The key events of the week were the speech of Federal Reserve Chairman, Jerome Powell, and inflation data, which turned out to be positive. The CPI (consumer inflation) index showed a drop of 0.1% compared to November, or +6.5% yoy. In November, there was an increase of 0.1% with a year-on-year value of 7.1%.
It is clear why this was extremely important: in early December, the rate was raised less than originally planned (by 0.5% instead of 0.75%), and it was fundamentally important to understand whether this action would not have a negative effect on price growth. If inflation were to rise relative to November, it would be necessary to raise the rate sharply, which would jeopardize the financial markets (which “do not like” rate increases), and give trump cards to the Republicans, who took control of the House of Representatives (the lower house of the US Congress). And Biden’s announcement that he wants to run for the presidency again would not look very good.
Let’s look at what Powell had to say in a speech prepared for a forum on central bank independence sponsored by the Swedish Riksbank, before inflation data was released, but certainly already knowing it: “Restoring price stability when inflation is high may require action unpopular in the near term as we raise rates to slow the economy. The lack of direct political control over our decisions allows us to take the necessary measures without looking at short-term political factors.” In other words, he immediately “dismissed” possible accusations of political engagement. But let’s face it: it is very likely that the consumer inflation figures were deliberately embellished, based precisely on political expediency!
Note that there are no data on industrial inflation yet, they will be available next week. Maybe they can shed some light on the situation. But the overall picture in the US economy is not at all rosy, and this will be seen in the following sections of this Review. In the meantime, we note that the data on “net” (that is, without taking into account the highly volatile components of food and fuel) consumer inflation does not show such a striking improvement: growth of 0.3% December versus November, +5.7% yoy, despite the fact that in November there was +0.2% m/m +6.0% y/y (the decrease in the annual indicator is due to the elimination of the high value for December 2021 from the annual statistics).
Macroeconomics
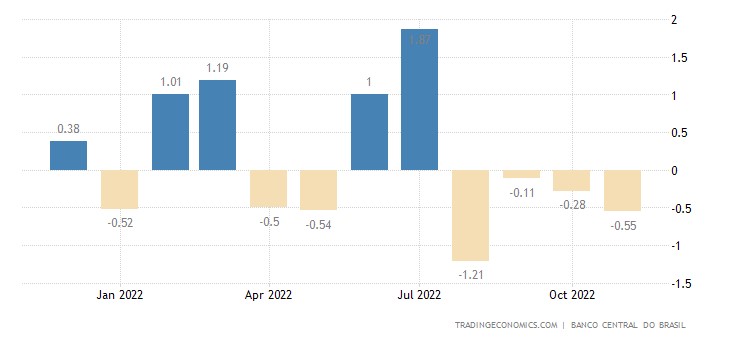
The Brazilian economic activity index has been declining for 4 months in a row:
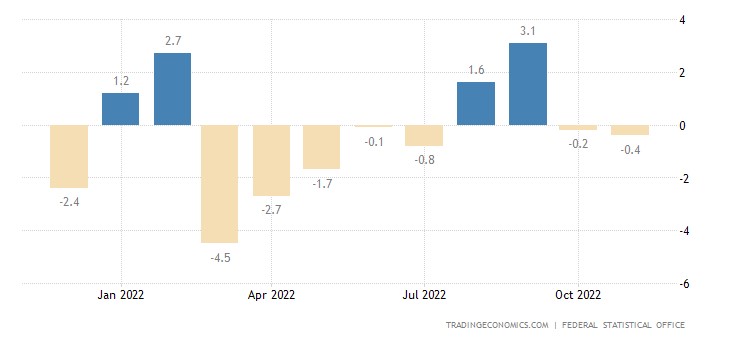
Industrial production in Germany -0.4% per year – 2nd negative in a row and 8th in the last year:
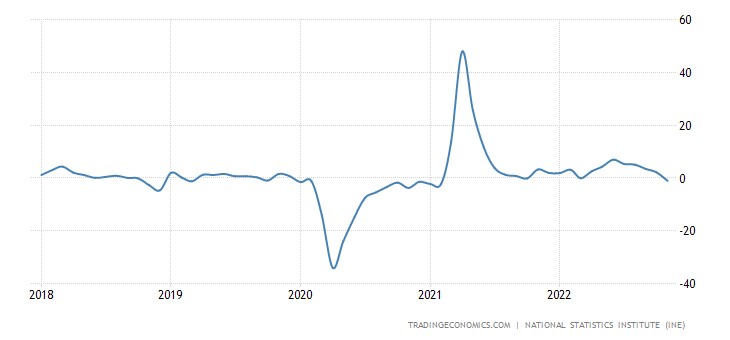
In Spain -1.1% per year – the worst dynamics in almost 2 years:
Turkish industry output -1.1% per month:
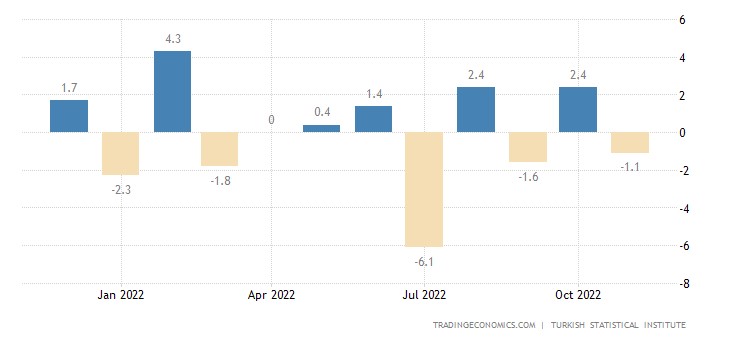
And -1.3% per year – 1st minus for 2.5 years:
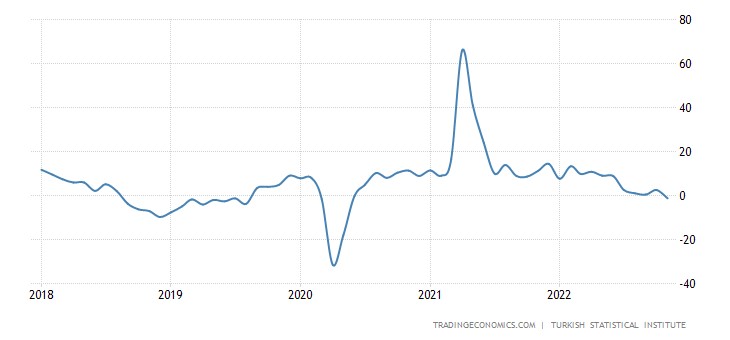
Since Turkey is an export economy, such data shows that it has begun to have problems with exports. In the domestic market, things have not been very good for a long time due to very high inflation.
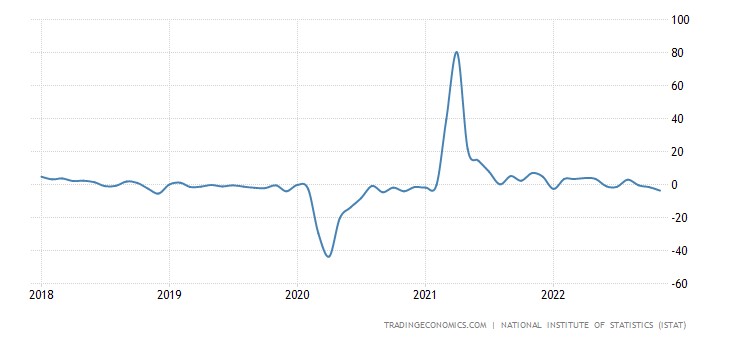
In Italy -0.3% per month – 3rd negative in a row:
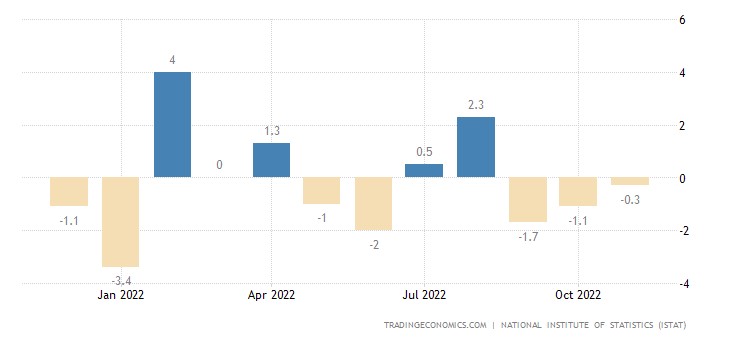
And -3.7% per year – the strongest drop in 2 years:
In Britain -0.2% per month – the 11th negative in a row:
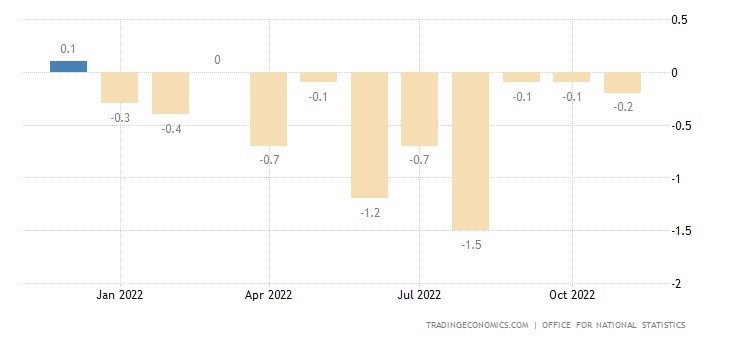
And -5.1% per year – the weakest dynamics in more than 2 years:
Small business optimism in the US is the worst in half a year and very close to a 10-year bottom:
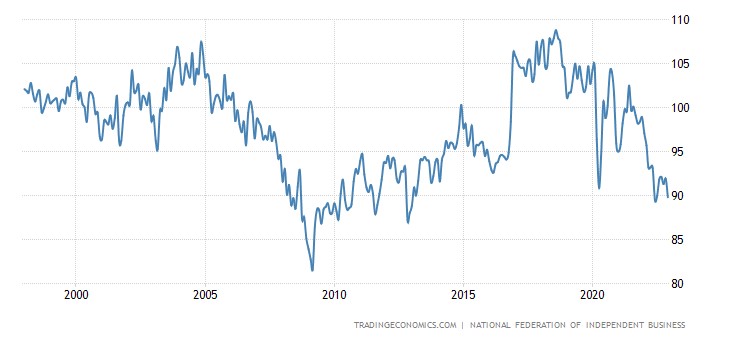
This is about the optimism of the official authorities. We will provide some more information in the next section.
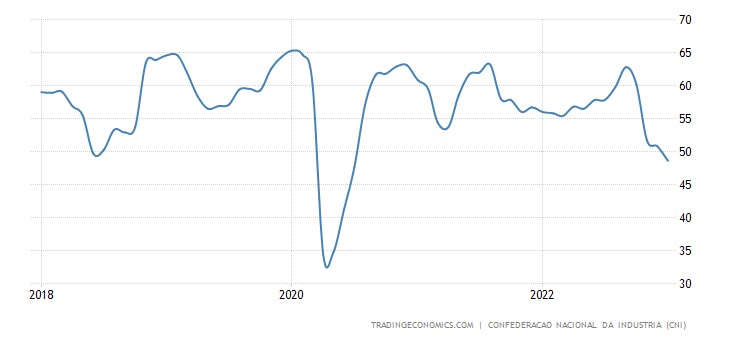
Business confidence in Brazil is at its lowest in 2.5 years:
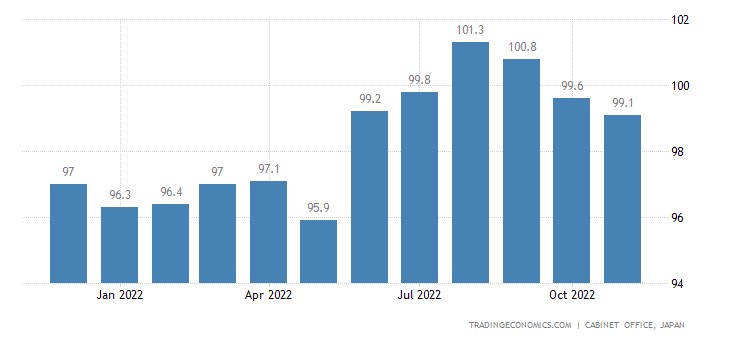
Leading indicators in Japan at the bottom for 2 years:
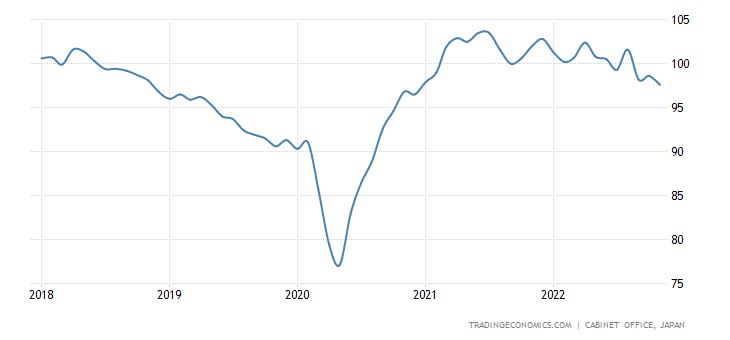
And coinciding – for six months:
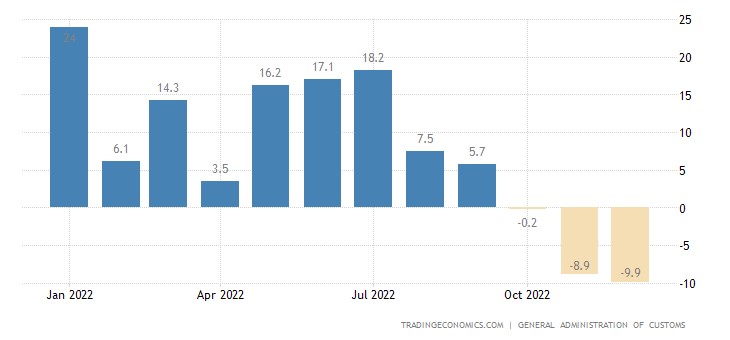
Export of China -9.9% per year:
Import -7.5% per year:
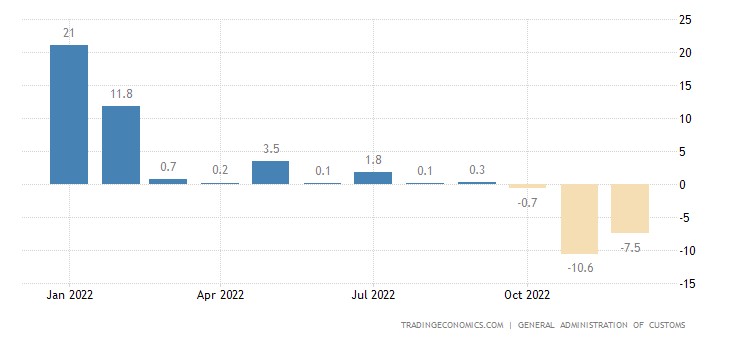
This is already straight oh-oh-oh, given that this is annual data!
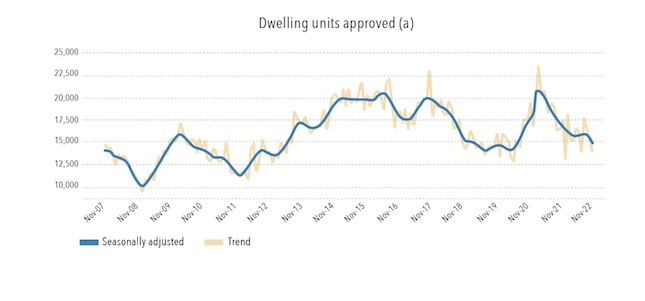
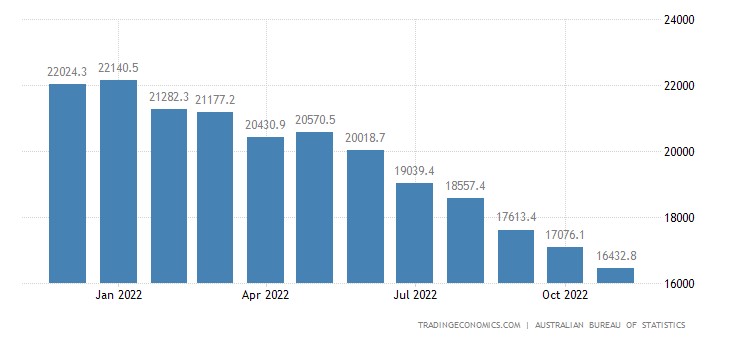
Australian building permits -9.0% per month – 3rd negative in a row:
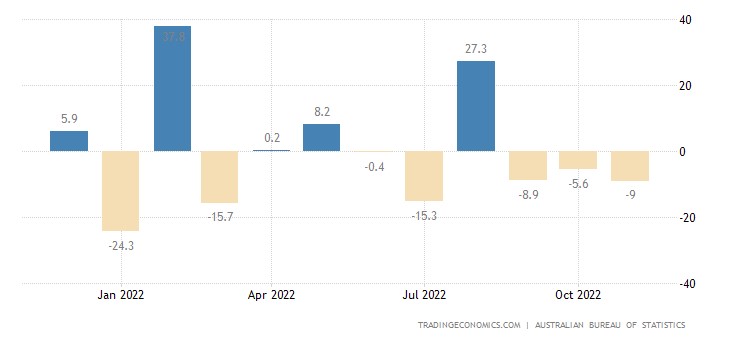
And -15.1% per year — the 14th negative in a row:
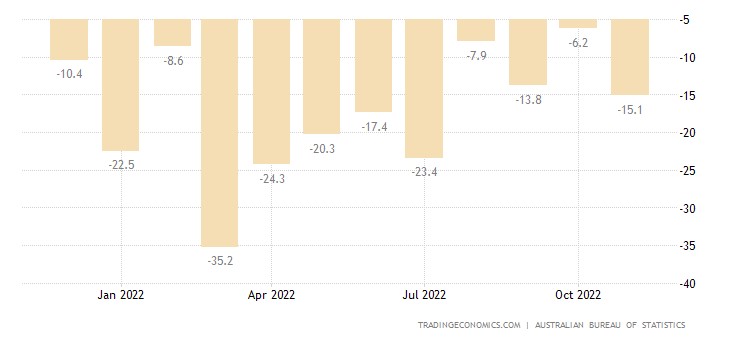
The indicator is back to pre-Covid levels that are in line with levels 10 years ago:
Australian mortgage applications -3.8% m/m (6th consecutive minus) and -24.8% y/y:
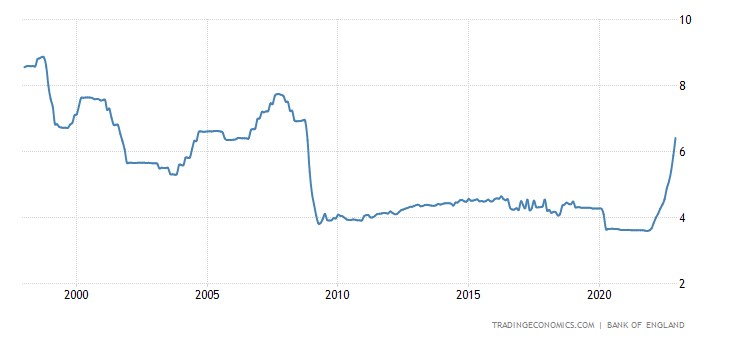
The average UK mortgage rate jumped to a 15-year high of 6.41%:
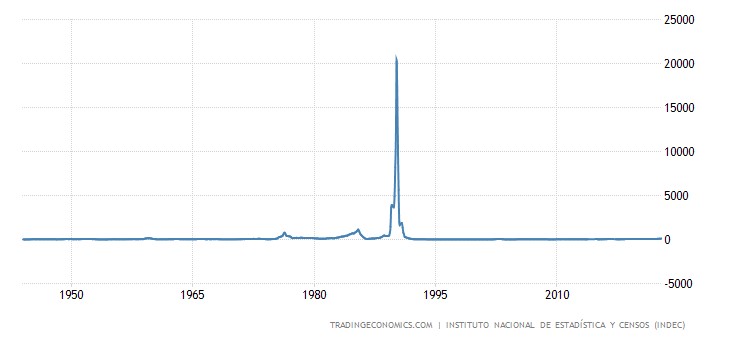
Argentina CPI +94.8% per year – peak since 1991:
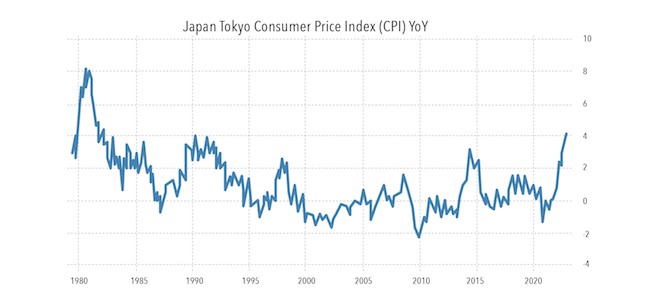
Tokyo Prefectural CPI in Japan +4.0% per annum – 40-year high:
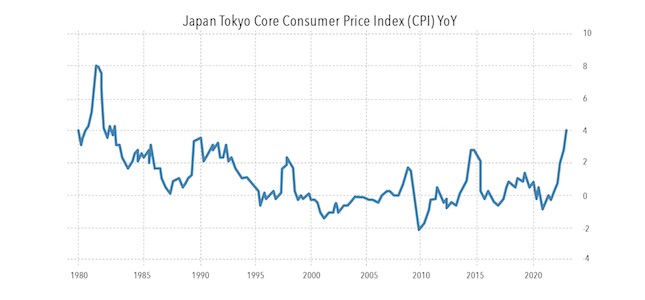
“Net” CPI is also +4.0% per year – and this is also the top since 1982:
Japanese household spending -0.9% per month:
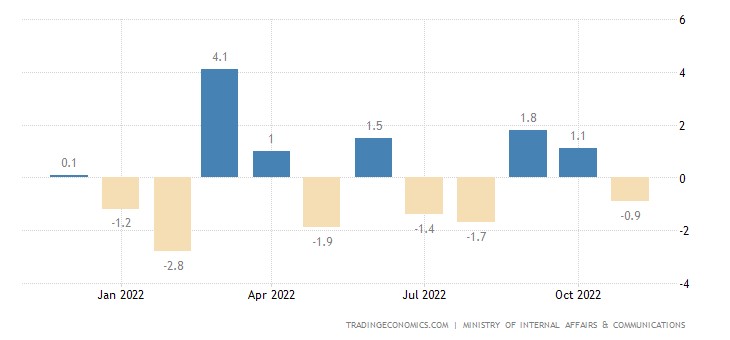
And -1.2% per year:
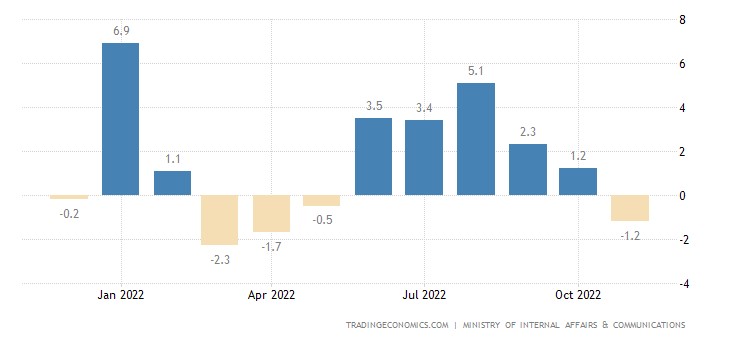
Unemployment in South Korea is the highest in a year:
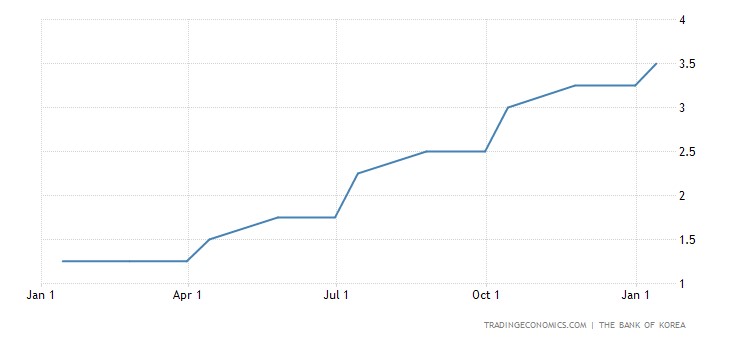
The Central Bank of South Korea raised the rate by 0.25% to 3.50%:
Main conclusions
Let’s add another fly in the ointment to the barrel of honey, which is demonstrated by the official “expert” publications. For the first time in many months, the number of initial applications of the unemployed in the US in December decreased to 205,000 (in November it was 206,000), despite the fact that the forecast was negative (215,000). But we have noted many times that labor statistics in the United States, or rather, its main indicators, are subject to serious distortions. But no one publicly discusses the indicator of the duration of the working week, in connection with which he can be trusted more.
The working week in December (seasonally adjusted, data from January 6) decreased to 34.3 hours compared to 34.4 in November. At the same time, forecasts promised growth to 34.5. Normally, employers tend to overburden existing staff rather than recruit new ones, so at the start of a period of economic growth (which Fed officials are hinting is about to begin, or has even begun), the workweek should be extended. If it falls, this means that stagnation continues, and quite strong, since the length of the working week is a very conservative indicator.
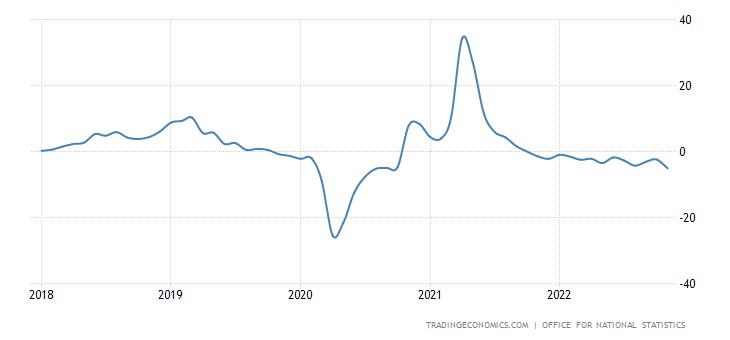
Further, many interpret the decline in inflation as a positive signal, the reaction of the economy to the monetary policy of the authorities. Indeed, the effect is clearly visible in the graph below for the EU:
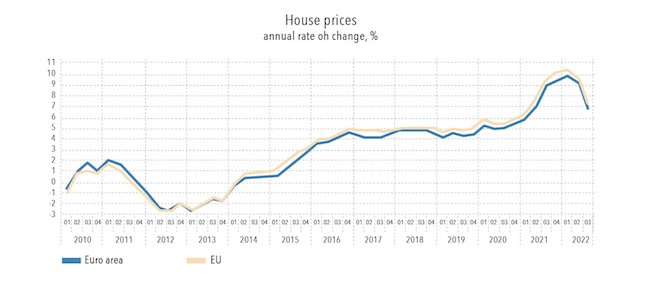
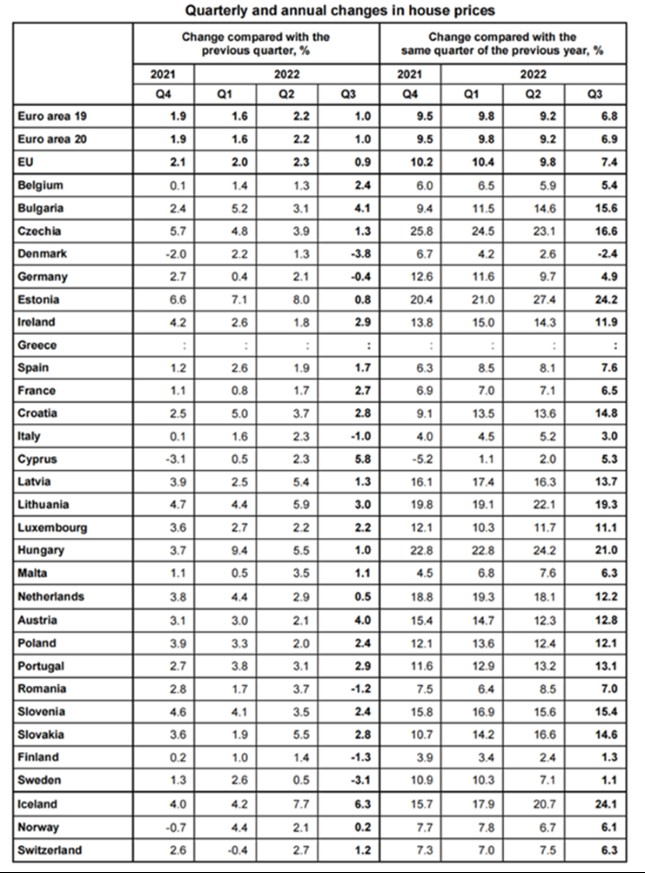
The trouble is that it is possible that such a positive effect, both in the US and in the EU, is associated with a drop in aggregate demand (sales volume). Sellers of any product in such a situation begin to reduce prices in order to maintain volumes. For the EU, this is all the more important since serious deindustrialization is beginning in the region. When large consumers fall out, margins will inevitably have to be reduced (recall that in the EU the main profit from gas sales is received by intermediaries).
At the same time, the cost of a loan is growing, this is very clearly seen in card loans in the United States:
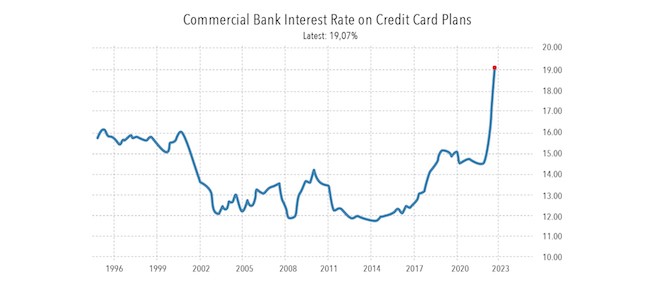
Here, by the way, the same law is perfectly manifested, only in the opposite direction: an increase in demand causes an increase in prices (that is, an increase in interest on a loan). Accordingly, in a few months this will give a new wave of falling demand, since part of the money that households spend on purchases today, they will be forced to give as payment for a loan.
Since the authorities do not recognize the economic downturn in either the US or the EU, they cannot explain the fall in inflation by lower demand. We estimate the real drop in GDP in the United States at the end of 2022 at 7-8%, and for this reason we cannot but note that the monetary component of inflation should be reduced not only because of the policy of the authorities (tightening monetary policy), but also because of -for a direct and obvious fall in demand.
At the same time, the structural component of inflation (associated with an increase in the cost of production of goods and services) does not depend in any way on the fall in demand: no matter how it decreases, it is impossible to sell at a loss in a market economy. When it comes to the resale of gas to the EU (where dealers’ profits can reach tens and even hundreds of percent), a serious price reduction is possible, although this source has almost been exhausted. But in industry and trade in market services, this is almost impossible. Accordingly, one can hope for a serious drop in inflation from current values only in a situation of a sharp decline in demand (that is, GDP), since in this case the structure of demand will change dramatically in the direction of the cheapest products. And there will be an increase in demand, against the backdrop of a landslide fall in more expensive (and high-quality) goods and services.


Exhausted?")