Oddly enough, the global economy got through this week with little to no highlights. Unless you count the «sensational» newspaper headlines, such as «The collapse of the dollar is already close.». Well, about the US default, and a possible collapse of the markets, and so on… If we look at the development of the situation with macroeconomics, then there are no sensations here; everything continues as usual.
Macroeconomics
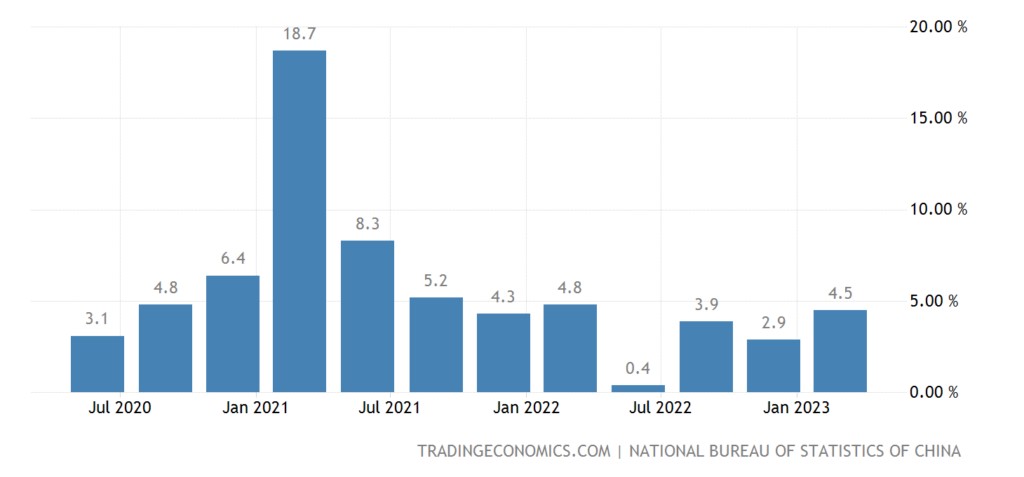
Chinese data for March is mixed. GDP grew stronger than expected (+4.5% per year):
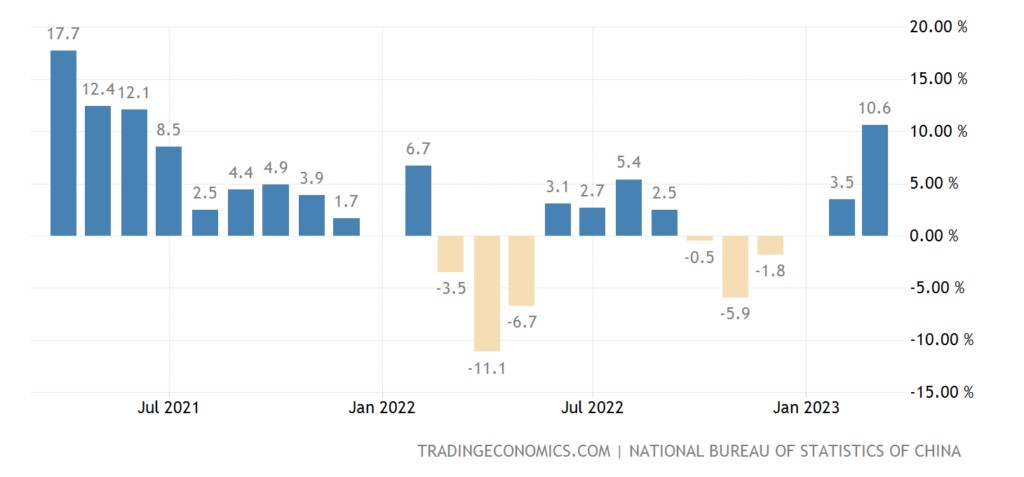
This was more clearly manifested in the data on retail sales (+10.6% per year — a peak in almost 2 years):
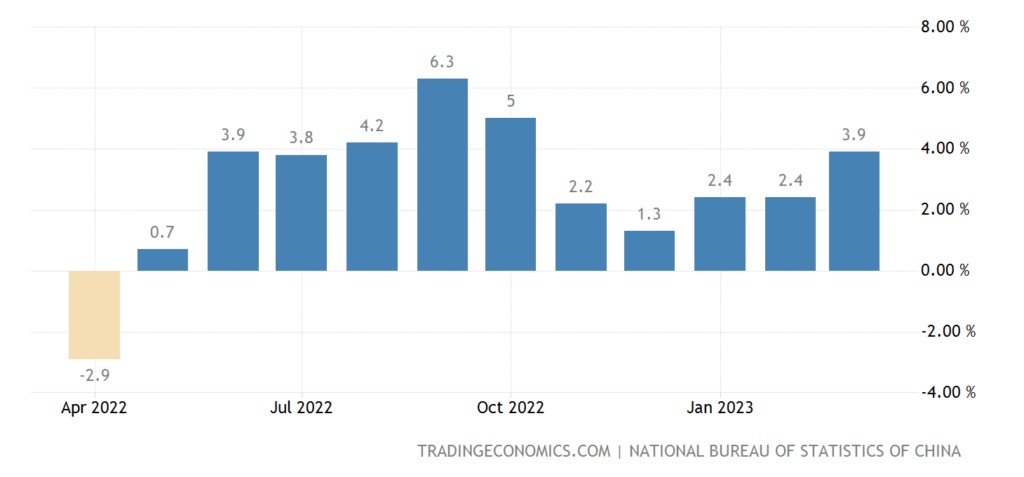
Industrial production recovers more slowly (+3.9% y/y vs. expected +4.0%):
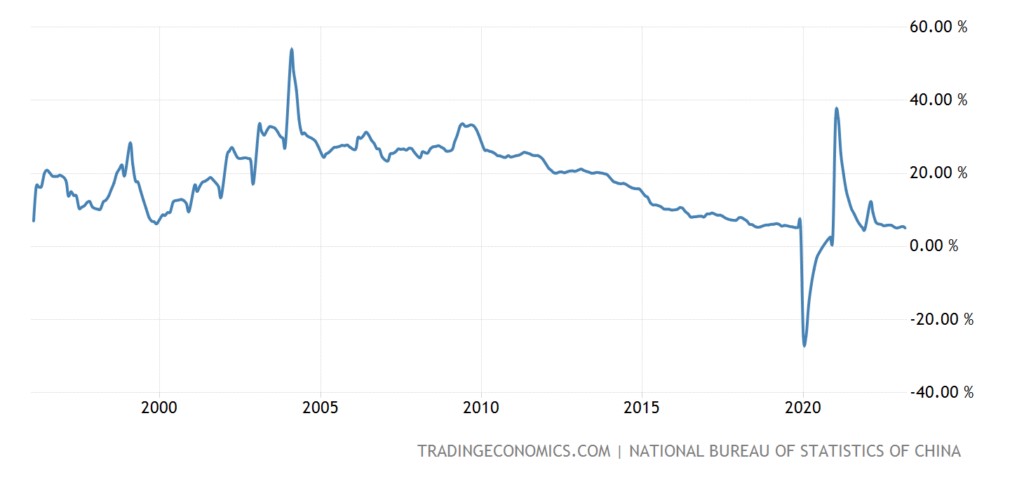
And investment in fixed assets slowed down to +5.1% per year — minus the covid dip, this is a record low for 27 years of observations:
What is happening here is not yet very clear, you need to understand. What we promise to do in the coming weeks.
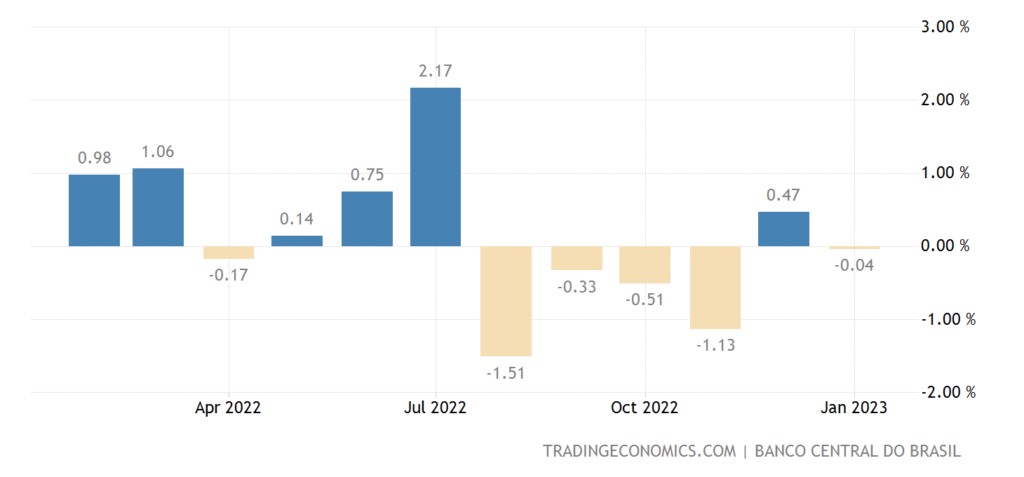
Economic activity in Brazil -0.04% per month — 5th negative in the last 6 months:
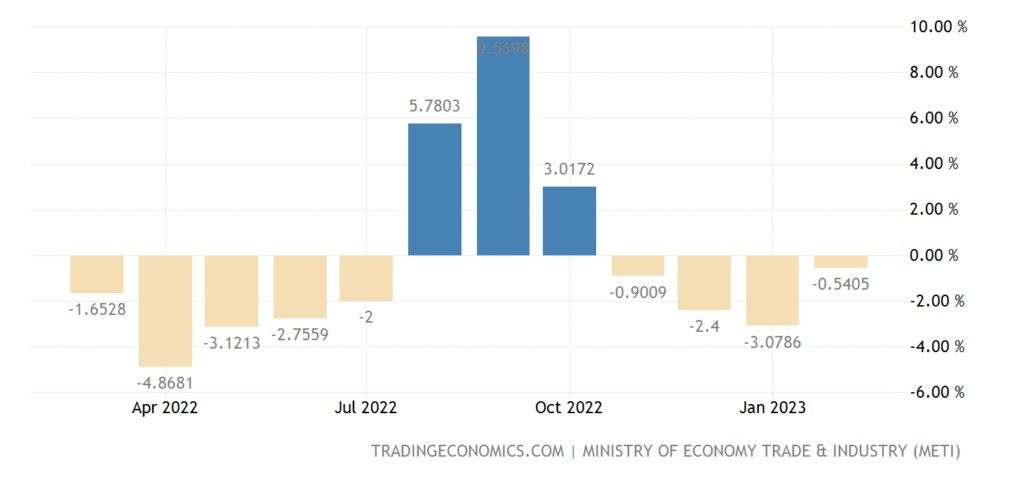
Industrial production in Japan -0.5% per year — the 4th negative in a row:
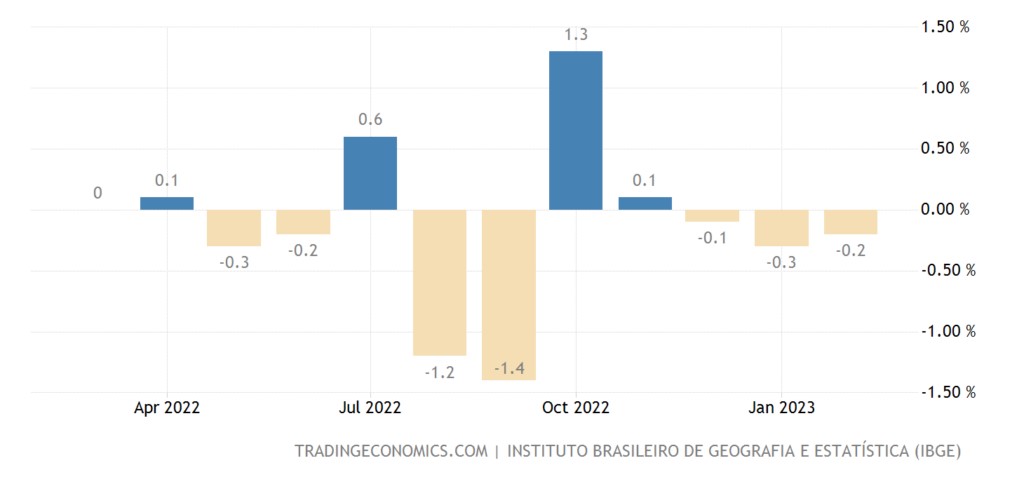
Brazilian industrial output -0.2% m/m — 3rd negative in a row:
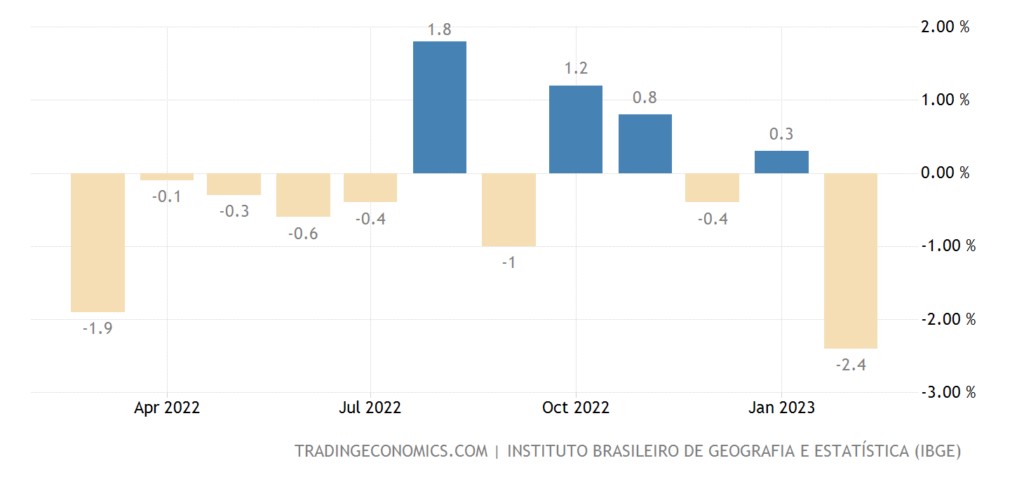
And -2.4% per year — the annual minimum:
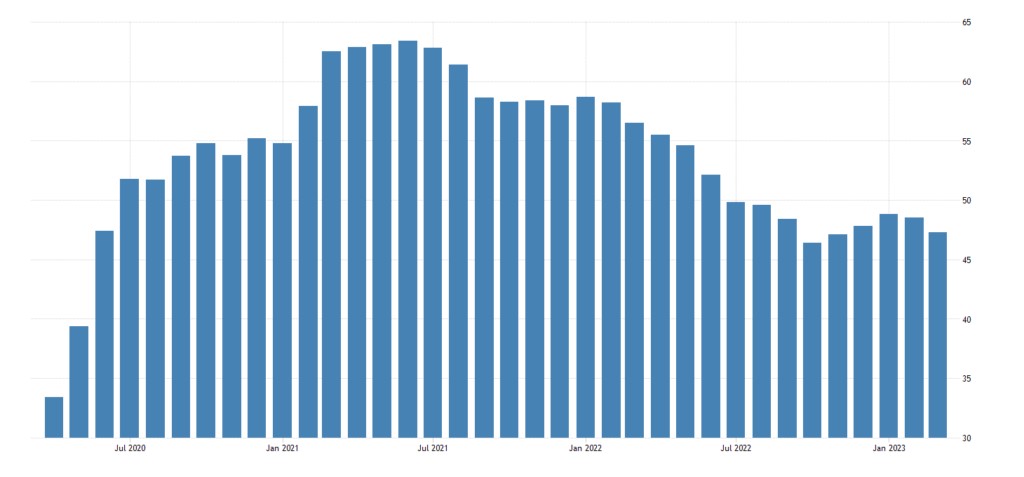
Manufacturing PMI (an expert index of the state of the industry; its value below 50 means stagnation and recession) of Australia (48.1) is the weakest in 3 years:
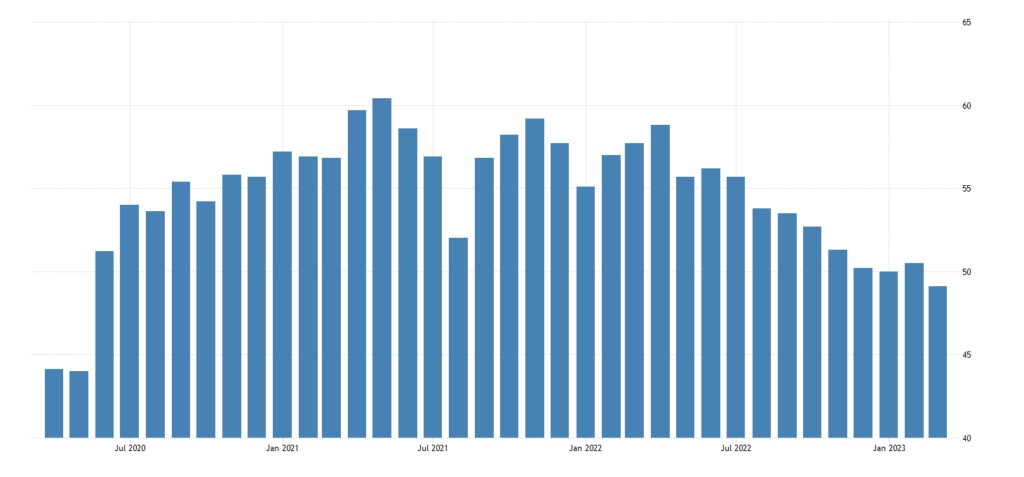
The minimum since the spring of 2020 and the eurozone (45.5):
ZEW Economic Sentiment Index in Germany is the lowest in 4 months:
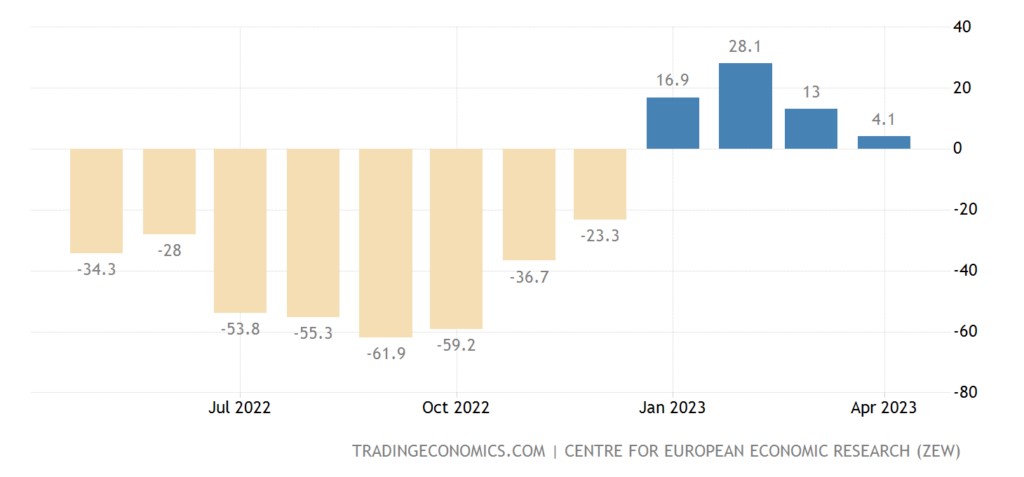
The same is true for the euro area as a whole:

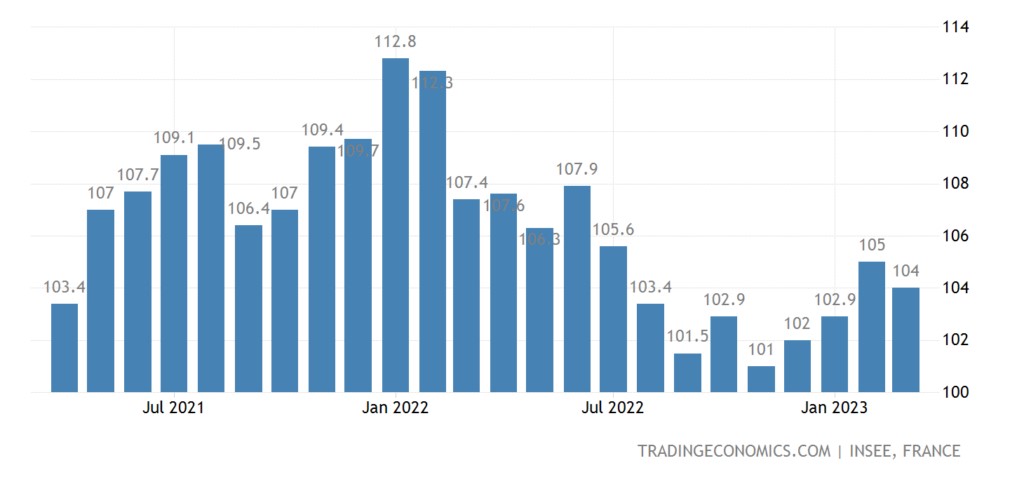
Business confidence in France weakest in 2 years:
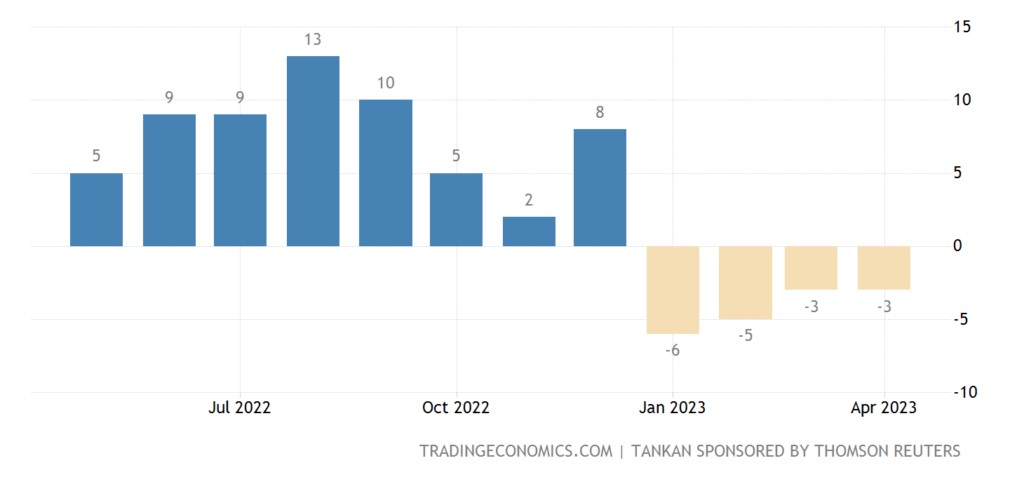
Japanese manufacturers’ sentiment (review by Reuters) keeps in the red for 4 months in a row:
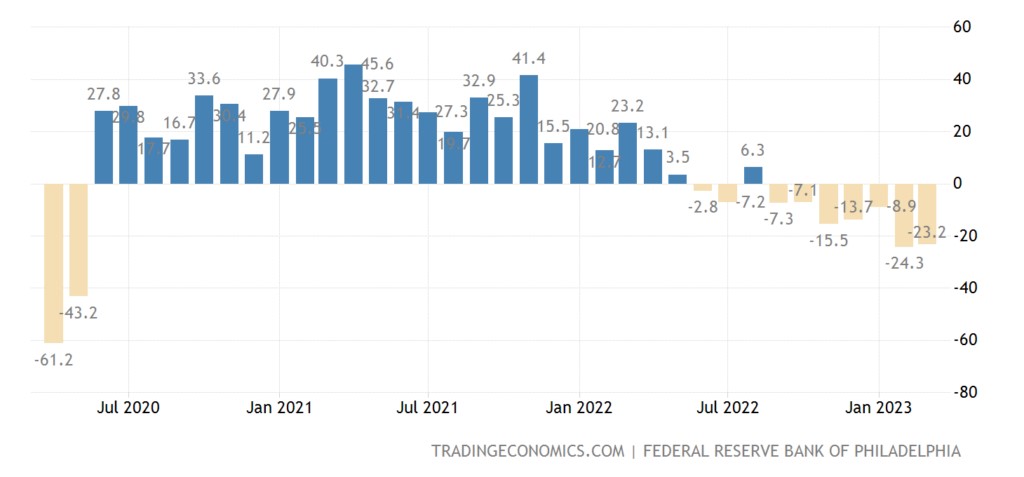
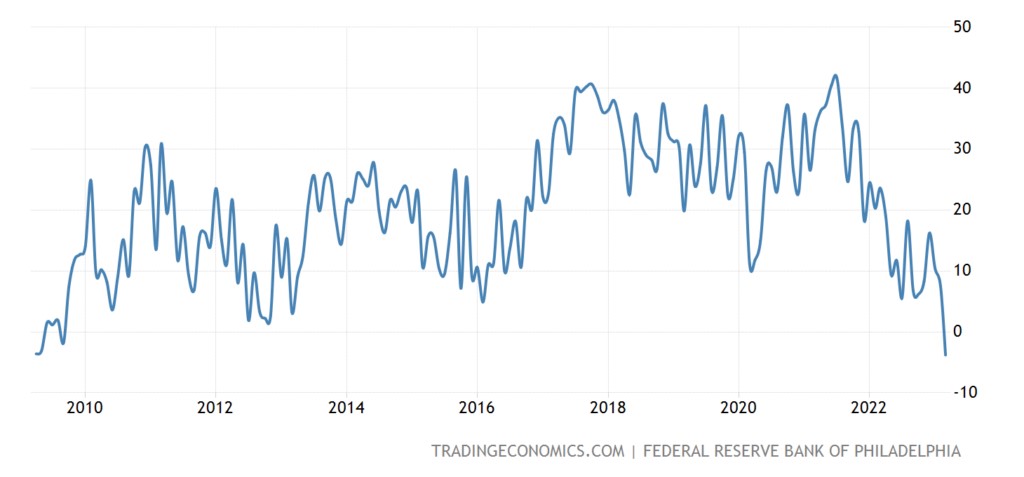
The Philadelphia Fed Index is the lowest in 3 years, and excluding the failure of 2020, in 14 years:
Capital investment plans especially sank — their balance sheet is the worst since 2009:
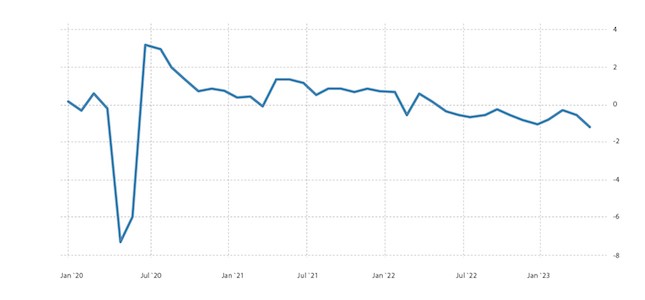
Leading indicators in the US -1.2% per month — the strongest decline in 3 years and the 12th negative in a row:
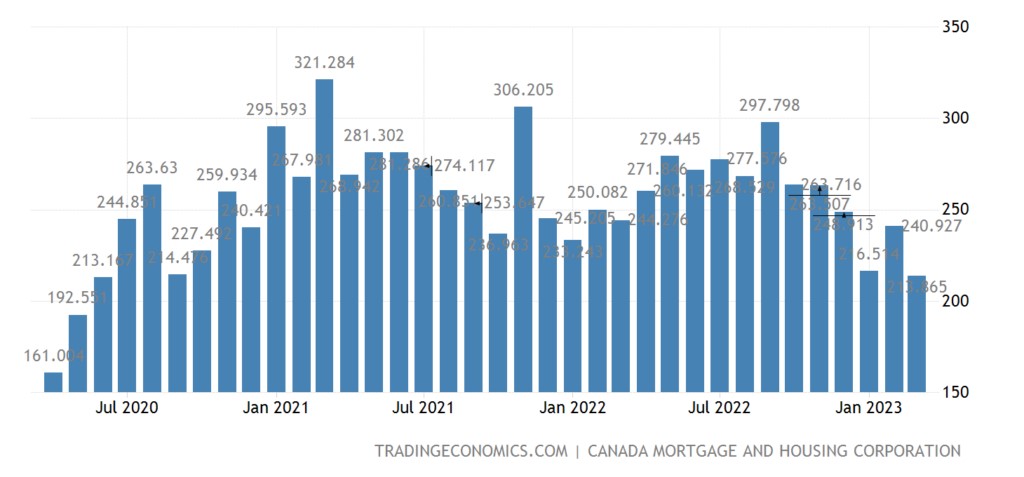
The number of new buildings in Canada at the bottom for 3 years:
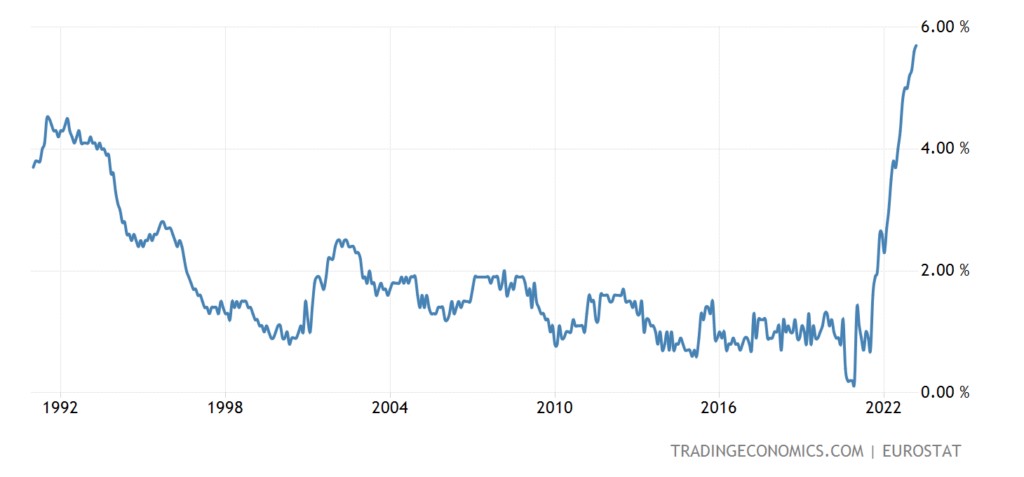
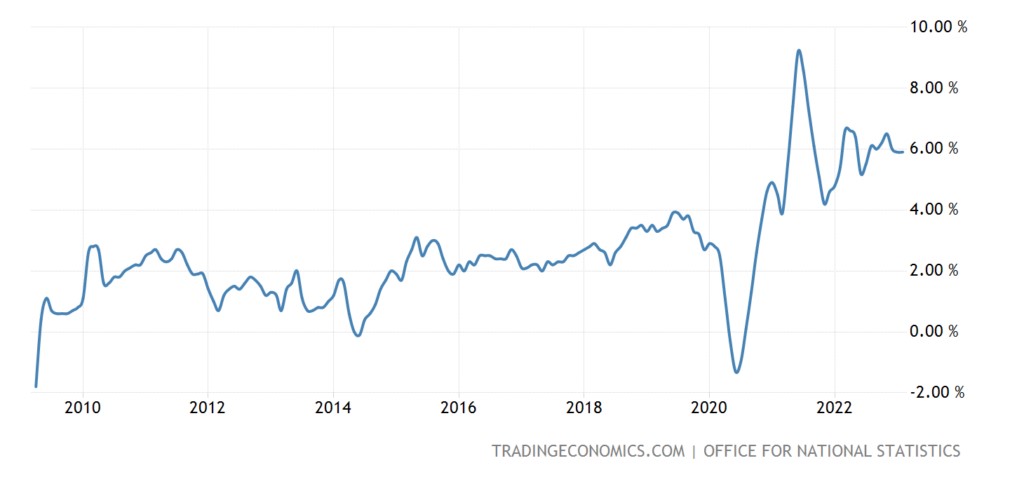
Eurozone net CPI (consumer inflation index) +5.7% per year — a record for 32 years of data collection:
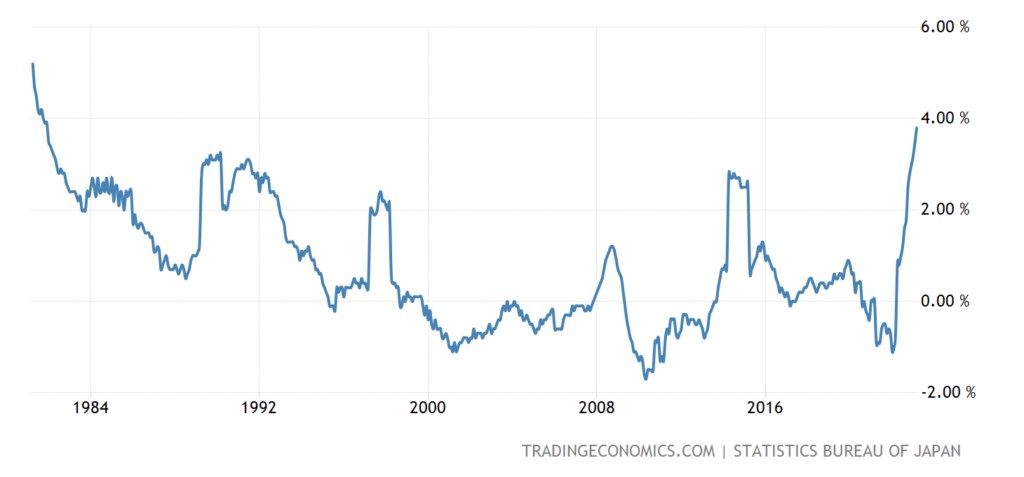
CPI without food and fuel in Japan +3.8% per year — the highest since 1981:
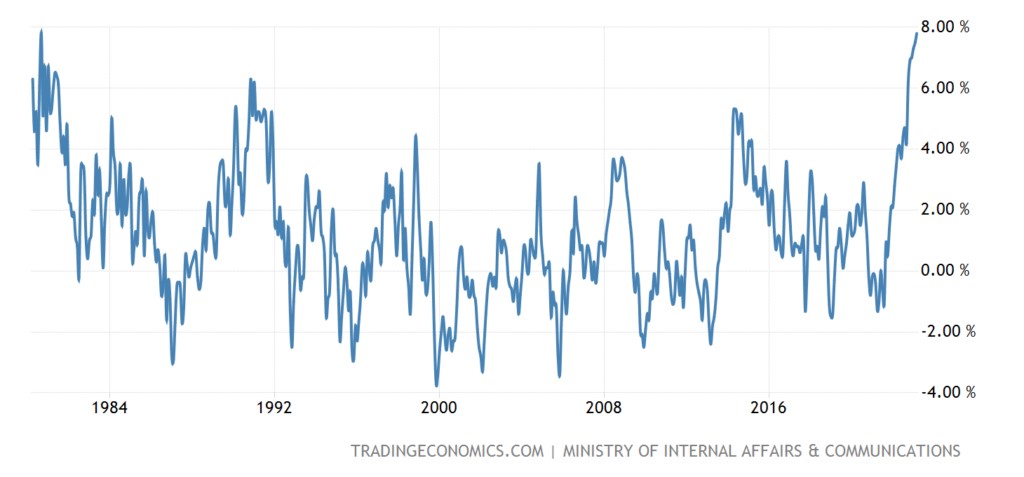
At the same time, the cost of food + 7.8% per year is very close to the peak of 1980:
PPI (industrial inflation index) Germany -2.6% per month — 6th negative in a row:
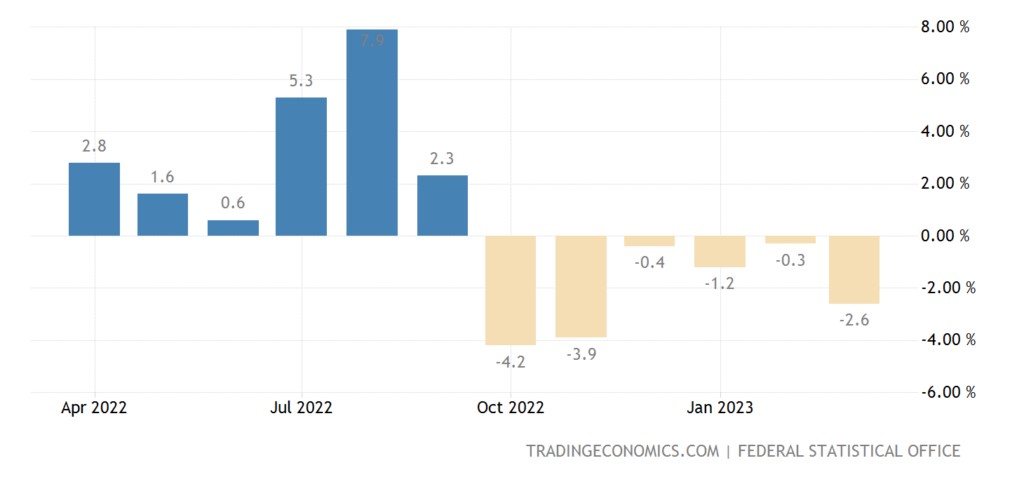
The same picture as in the US is a clear manifestation of deflationary tendencies.
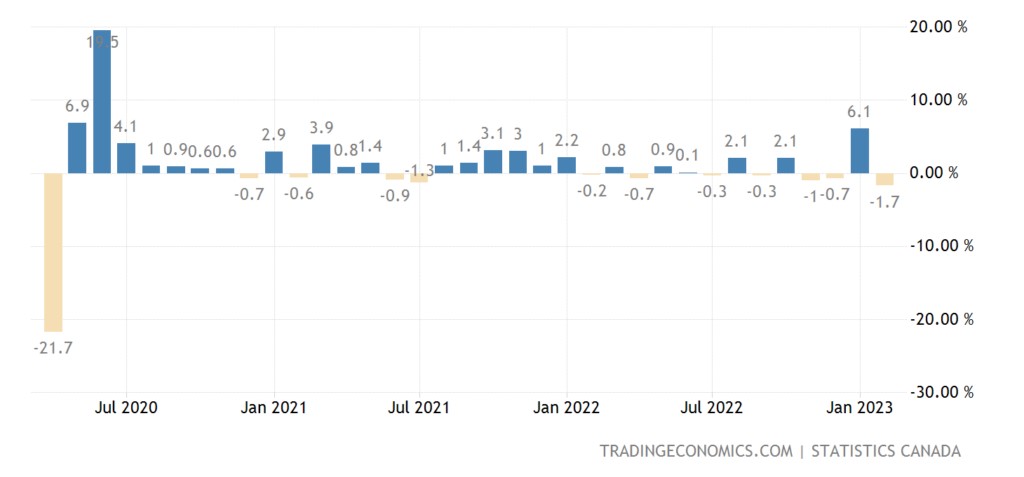
Wholesales in Canada -1.7% per month — 3rd negative in the last 4 months and a 3-year low:
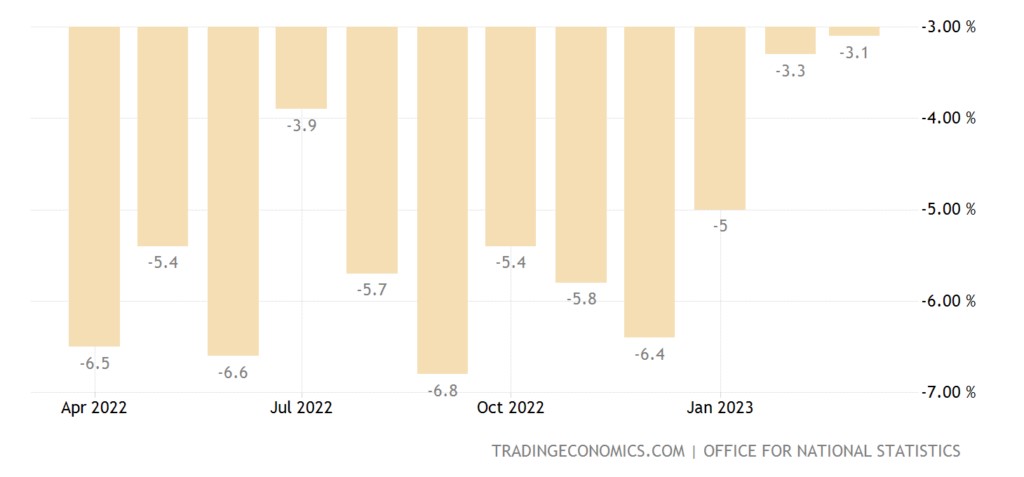
Retail sales in the UK -3.1% per year — 12th consecutive negative:
The growth of registered unemployed in Britain (+28.2 thousand per month) is the worst in 2 years:
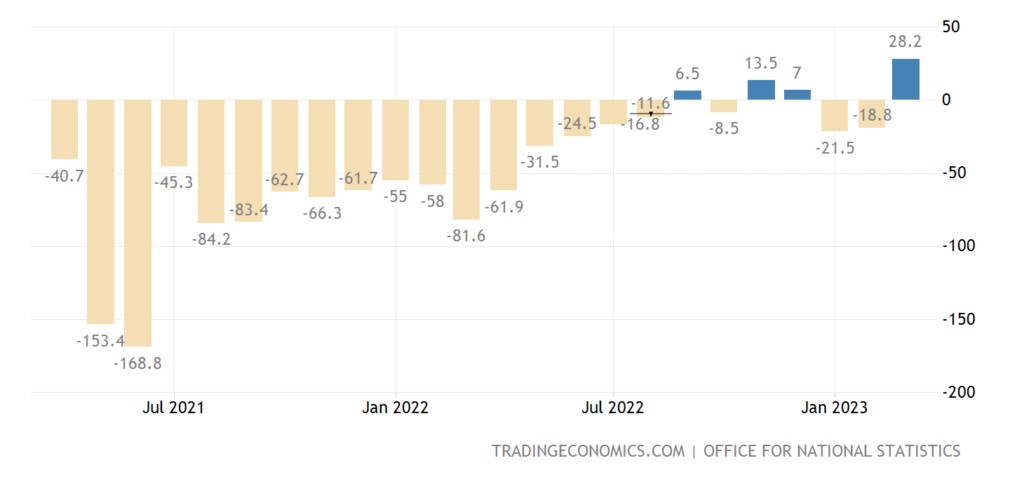
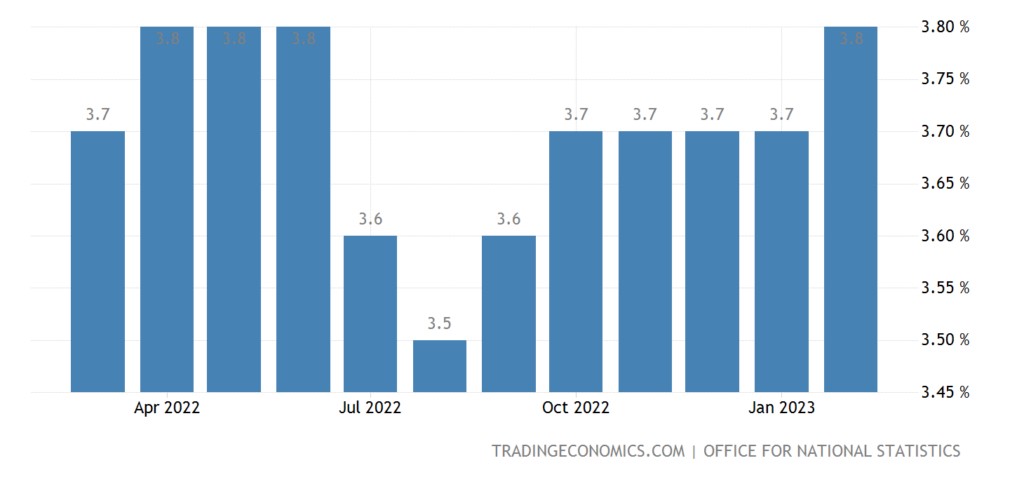
Why the unemployment rate at the annual peak:
Real (inflation-adjusted) wages and bonuses at -3.0% per year — the strongest decline since 2009:
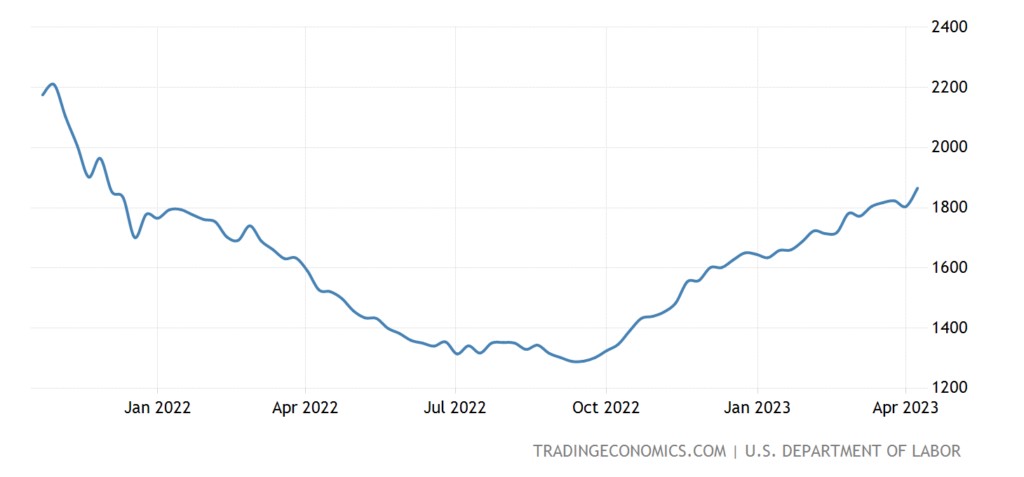
The number of recipients of unemployment benefits in the United States for a maximum of 1.5 years:
The Central Bank of Argentina raised the rate by 3% to 81%. The Central Bank of Indonesia did not begin to change monetary policy, as well as the Central Bank of China.
Main conclusions
Here we have the most usual calm week now. But there are some points that I would like to point out. In particular, the German industry.
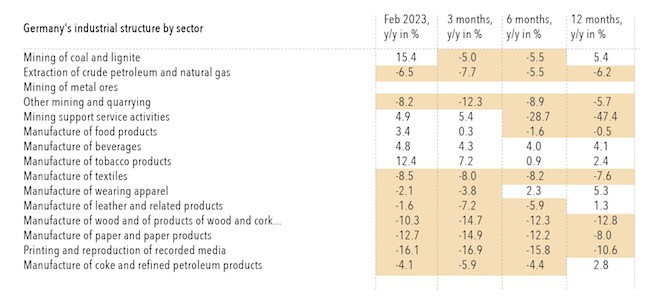
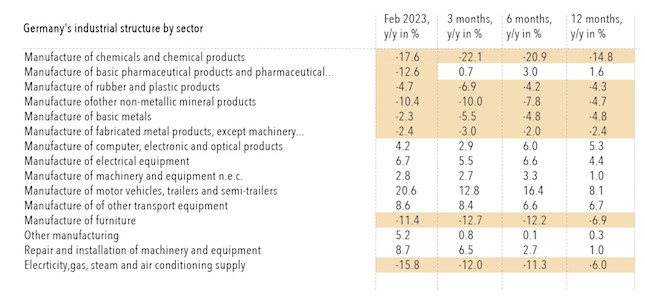
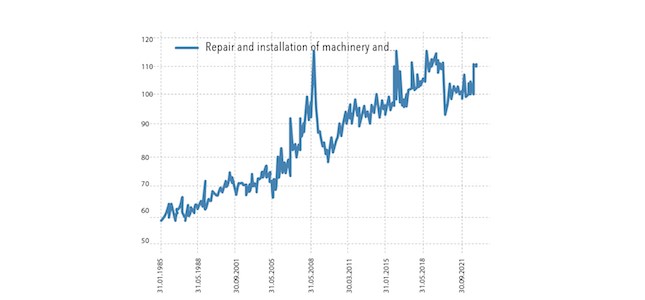
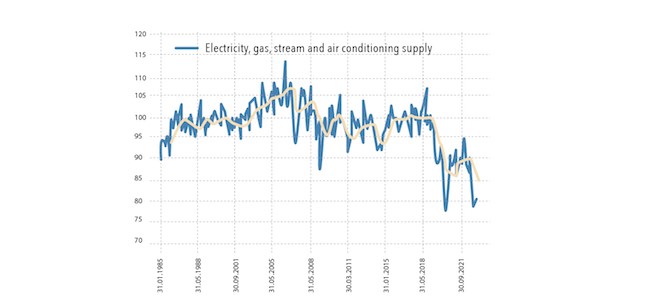
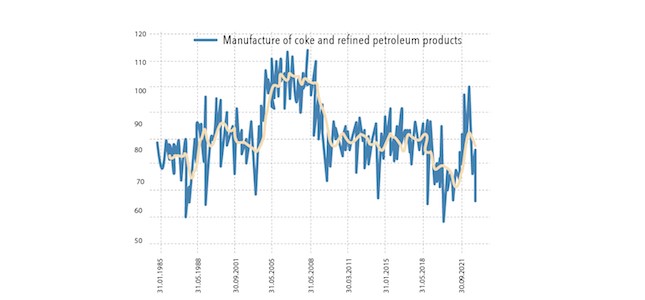
What does it mean? Does this contradict the data presented in the previous section? The answer, of course, is, and it looks something like this. First of all, any statistics today are monetary statistics. That is, growth means an increase in revenue, not unit sales. And to compare prices, you need to know exactly inflation … And not only the general one (that is, the PPI index) but also a specific sector of the economy. Inflation is actively underestimated — therefore, excessive optimism is unnecessary.
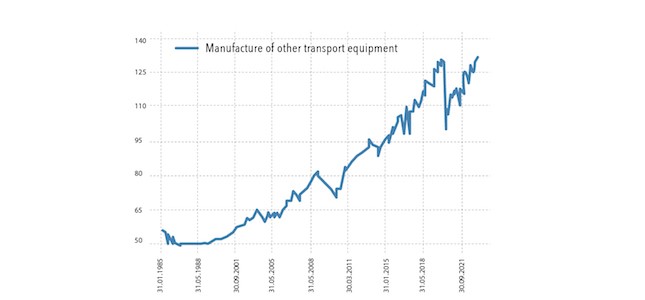
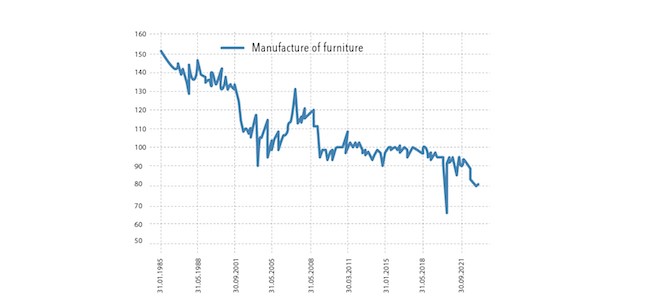
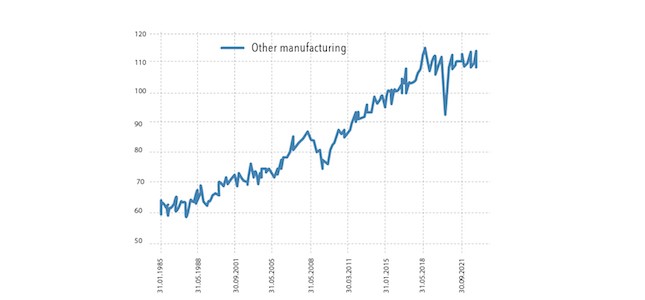
In addition, the industry's fall may be accompanied by a fall in some regions and an increase in others (since the remaining consumers are being redistributed). It is only partially correct to talk about the growth of transport engineering in Germany by assessing how the enterprises of the corresponding industry look in other EU countries. And there are other moments, for example, a sharp reduction in costs because enterprises do not index salaries and payments to suppliers … And much more.
For this reason, when describing a systemic crisis, which is the current crisis, it is not entirely correct to talk about the state of individual companies and industries. But the overall picture is given by macroeconomic data, which in Germany could be better.
And finally, one of the characteristics of construction in the USA:
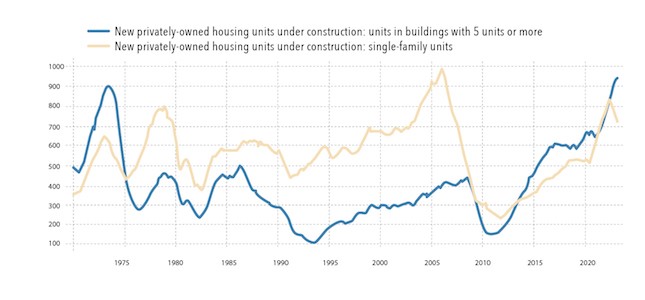
We are seeing a sharp split in trends, with single-family home construction on the decline and multi-family housing on the rise. The blue line may also go down soon, and the picture may even out, or this is the beginning of a long-term trend towards changing social patterns. In any case, this is a very interesting point.
Note that it is challenging to determine which graphs are best used to describe the current situation. We have noted more than once that hundreds and thousands of parameters represent macroeconomic data. Those who wish can conclude their study, and links are easy to find on the Internet, including from the graphs we provide. But concluding them is much more difficult.


Exhausted?")