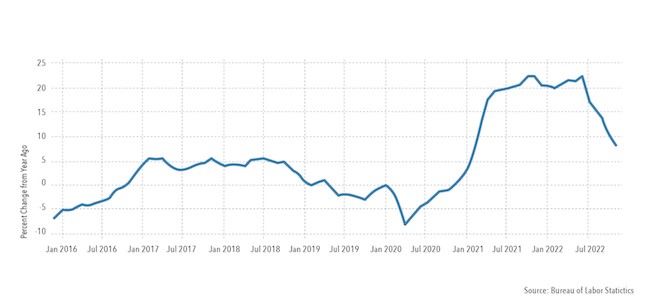
For two weeks, the Fed leadership discussed the question of where to put a comma in the phrase "raise cannot be stopped" in the appendix to the discount rate. This week they received two signals at once in this regard and, as often happens, in opposite directions. On the one hand, the broad industrial price index showed a decline:
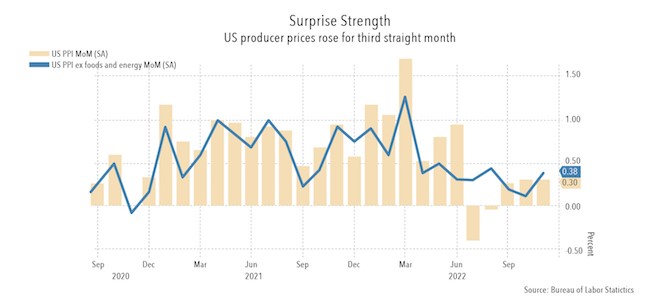
On the other hand, the weekly industrial price index (PPI) showed a more significant increase (+0.3%) than planned (+0.2%):
Which conclusion will be drawn from this is a difficult question since the leading role will be played not by objective but by subjective factors. But one thing is clear – Fed officials will have to make a difficult decision. At the same time, it should be considered that no improvement in the macroeconomic situation is observed, which is the video from the next section of this Review.
Macroeconomics
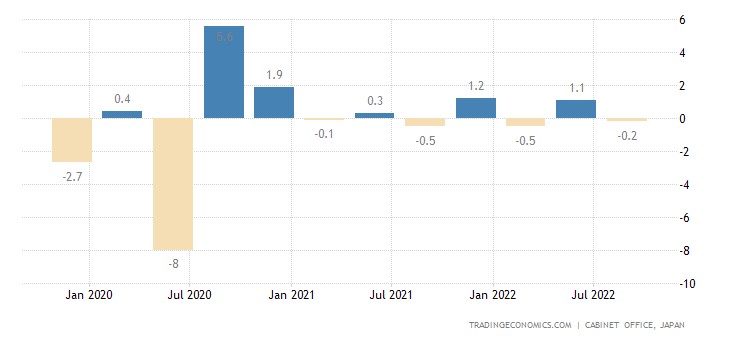
Japan’s GDP -0.2% per quarter – in the last 1.5 years it has been going from plus to minus and back
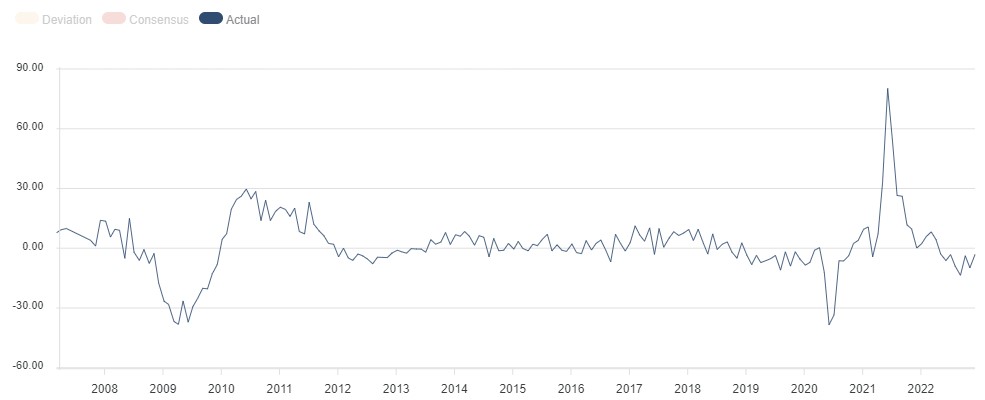
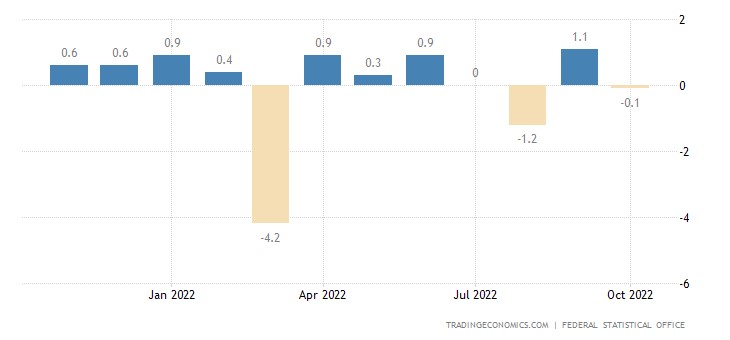
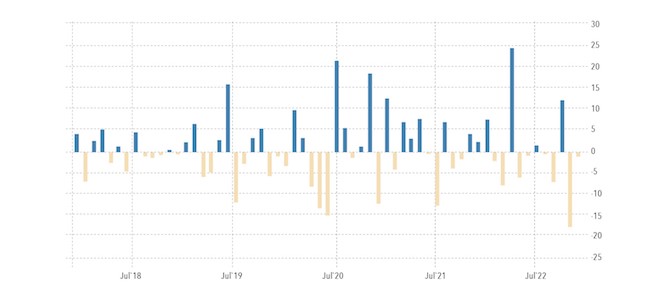
German industrial orders keep in the red for 8 consecutive months:
And production -0.1% per month:
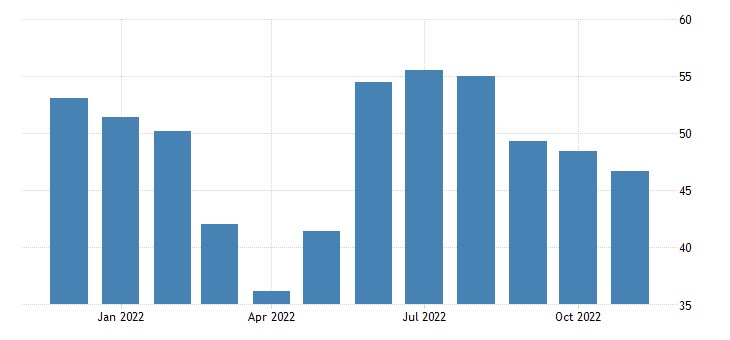
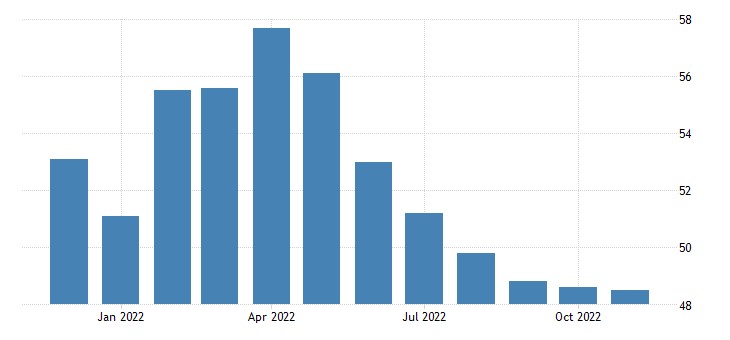
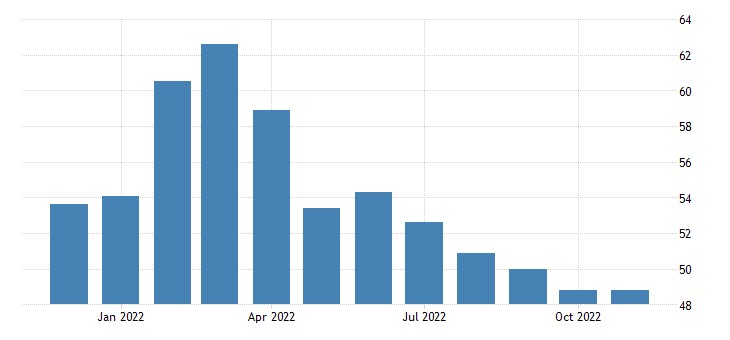
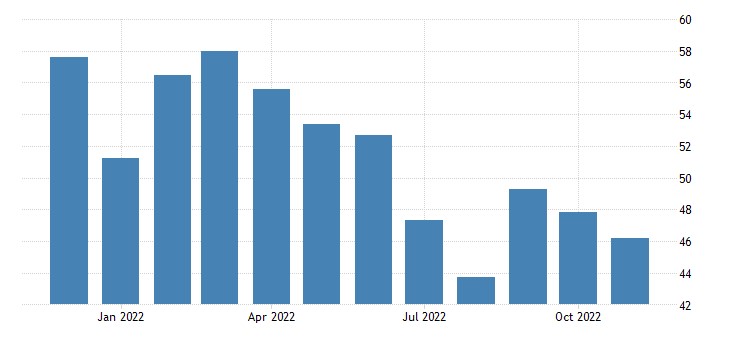
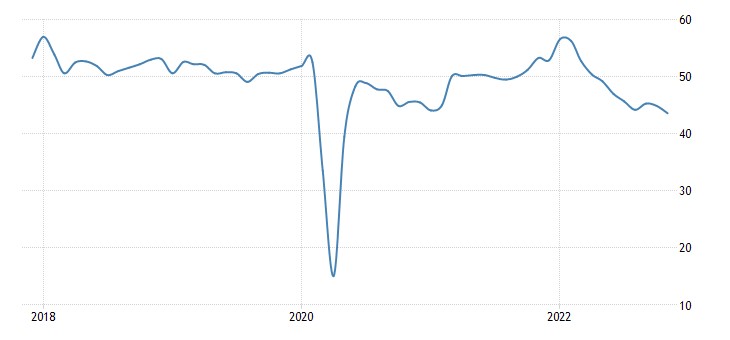
PMI (an expert index of the state of the industry; its value below 50 means stagnation and decline) of the service sector almost everywhere in the recession or stagnation zone:
in Australia (47.6 and 45.6 in two versions):
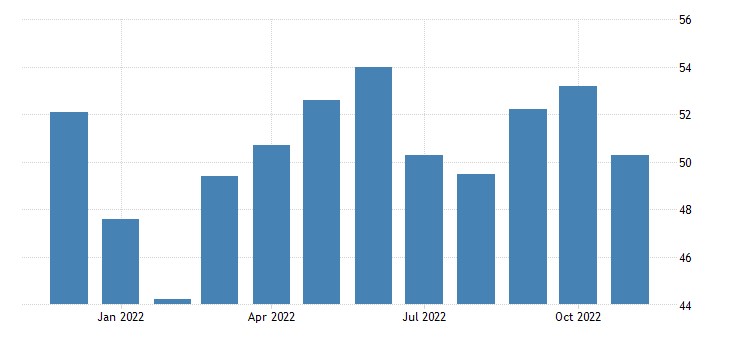
in Japan (50.3):
in China (46.7 amid record layoffs):
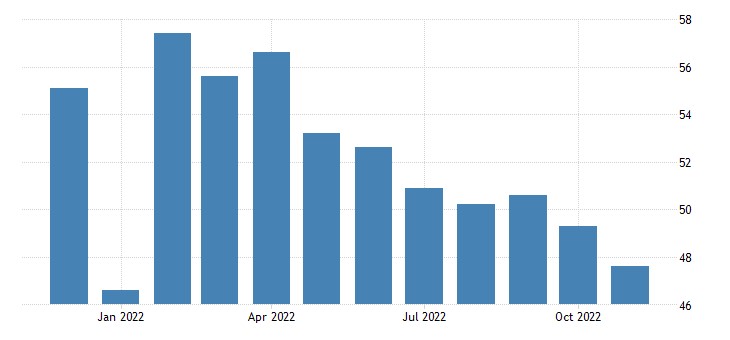
in the Eurozone (48.5):
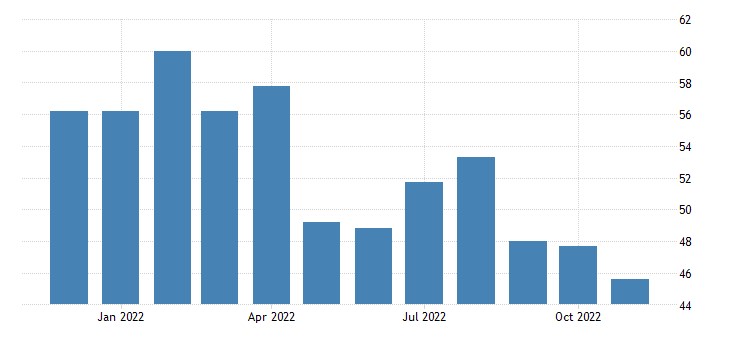
in the UK (48.8):
in the US (46.2):
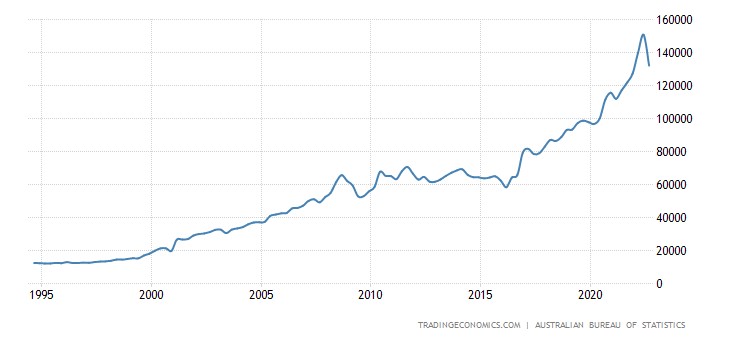
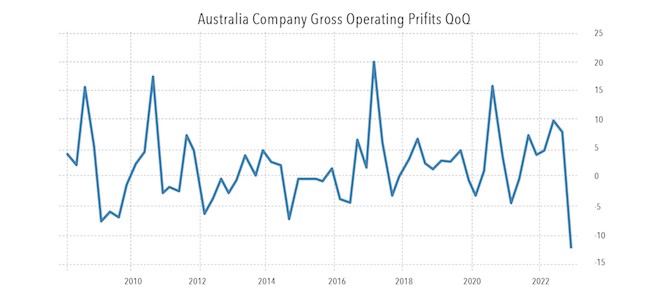
Profits of Australian companies -12.4% per quarter – an anti-record for 15 years of observation:
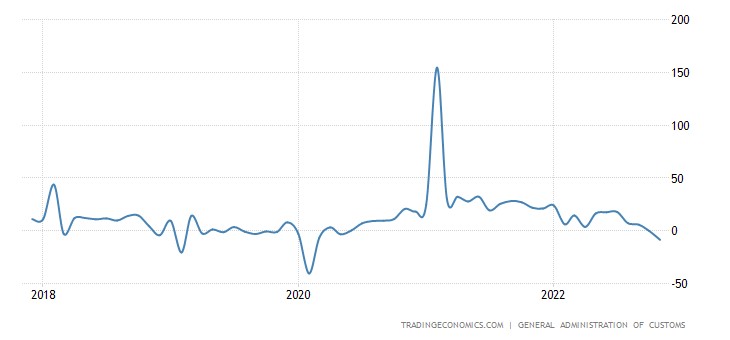
China’s trade balance is the worst in 7 months:
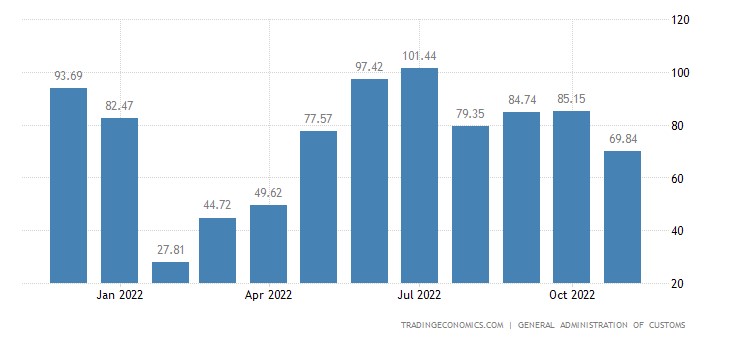
Like exports:
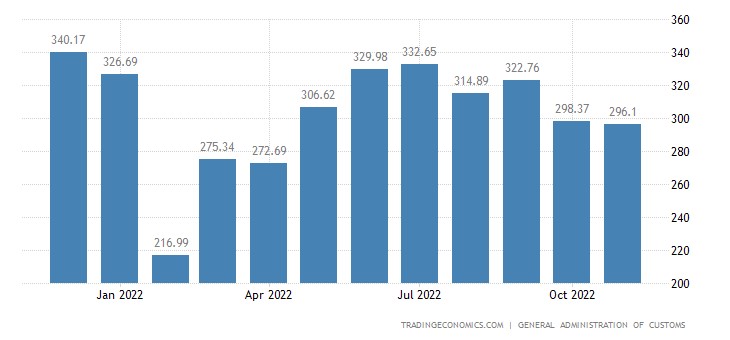
And its annual decline (-8.7%) is the highest in 33 months:
Eurozone construction PMI 43.6 – 2.5 year minimum:
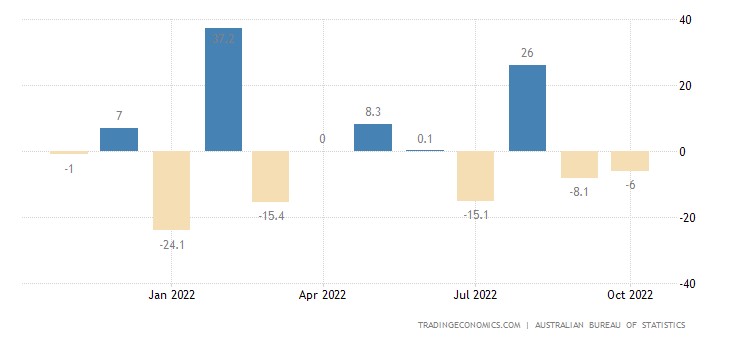
Australian building permits -6.0% per month – 2nd negative in a row and 3rd in 4 months:
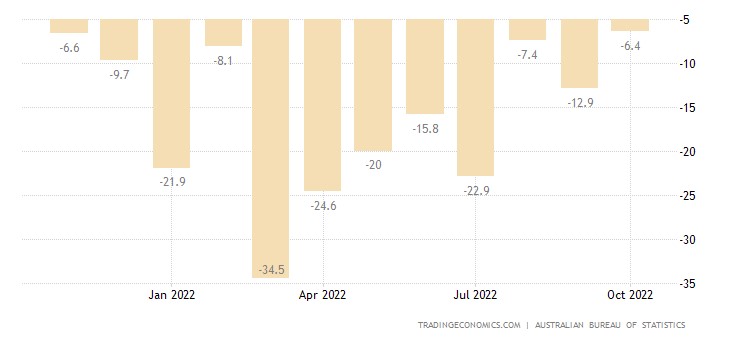
And -6.4% per year — the 13th negative in a row:
Building permits in Canada -1.4% per month – 4th minus in the last 5 months:
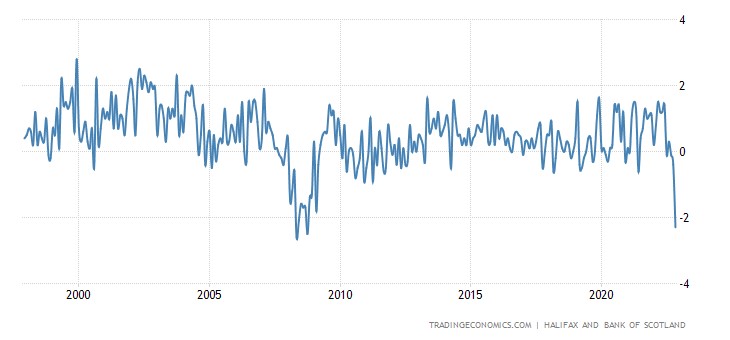
House prices in Britain -2.3% per month – the biggest drop in 14 years:
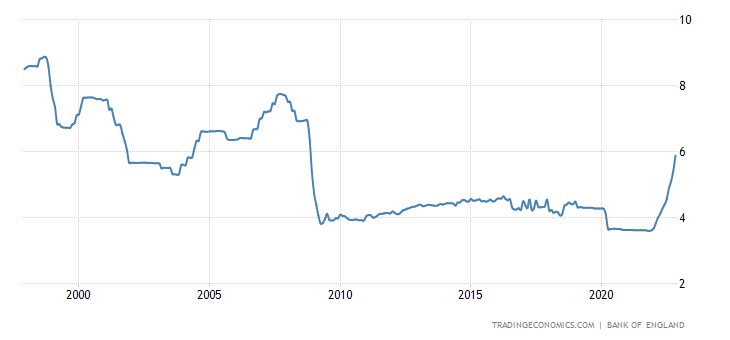
Because the mortgage rate in Britain is at its peak for the same 14 years (5.88%):
US Mortgage Interest Drops – But Mortgage Applications Fall Again:
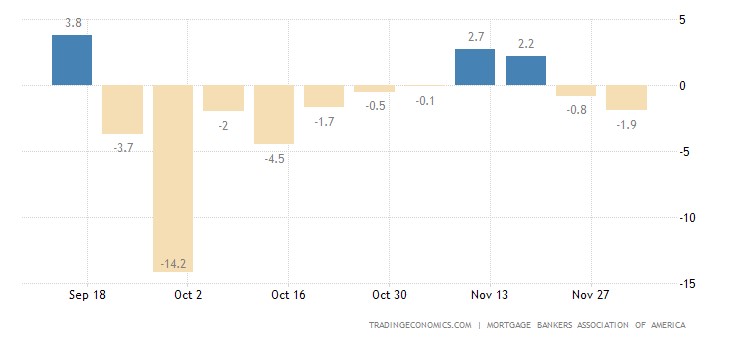
And this means that the problems in construction are connected not only with the rate, but most likely, the issues are more profound. Perhaps it's because, as the money supply shrinks and household incomes shrink (automatically), mortgages are becoming more and more of an unaffordable pleasure.
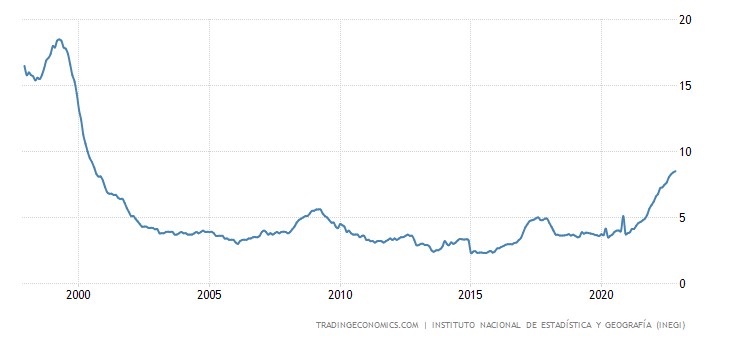
"Net" (excluding highly volatile food and fuel components) CPI (consumer inflation index) of Mexico +8.5% per year – 22-year high:
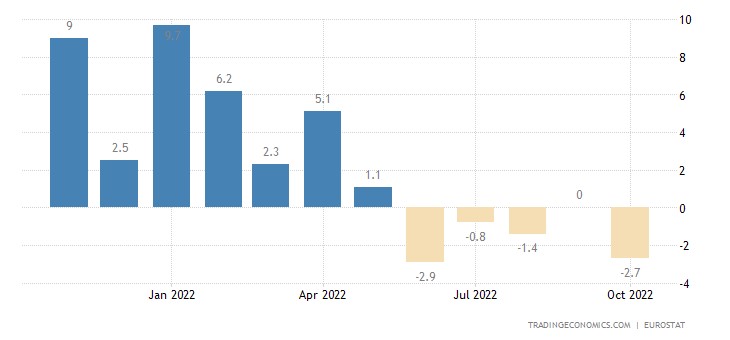
Eurozone retail sales volume -1.8% per month – over the past 5 months there was only 1 plus:
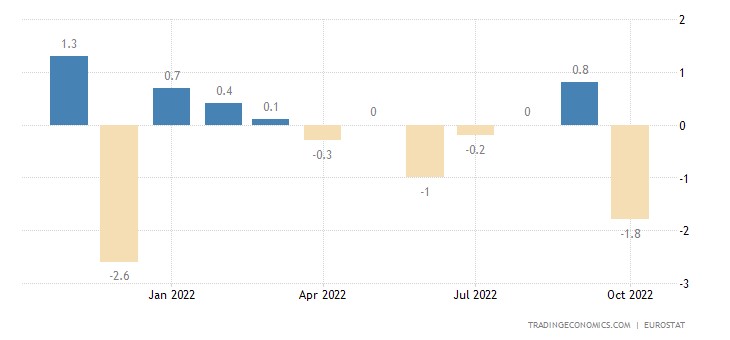
And -2.7% per year — the 5th minus (or zero) in a row:
US Jobless Claims at 10-month peak:
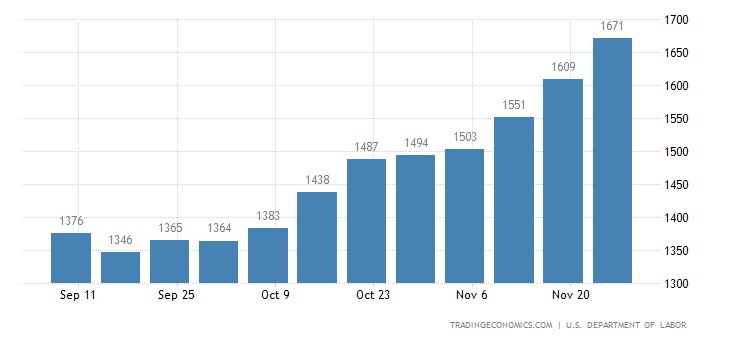
We remind you that US labor statistics in and of themselves are highly distorted and cannot be the basis for objective conclusions. But the fact that unemployment data has been deteriorating for more than a month may indirectly indicate that the situation in this area is not the best.
The Central Bank of Canada raised the rate by 0.50% to 4.25%, and the Central Bank of India increased the interest rate by 0.35% to 6.25%. The Central Bank of Australia raised the rate by 0.25% to 3.10%, while the Central Bank of Brazil left it at the same level of 13.75%.
Main conclusions
As it should be in a structural crisis, crisis processes develop evenly. No jerks, collapses or other negative phenomena.This is how the situation set from the spring of 1930 to the end of 1932. But there is one subtlety: the structural crisis was preceded by a stock market crash in the fall of 1929. Today, the crisis follows an inflationary, not a deflationary, scenario, which supports the stock market; there has not yet been a collapse (at least on the model of 2008). Although there are dangerous symptoms:
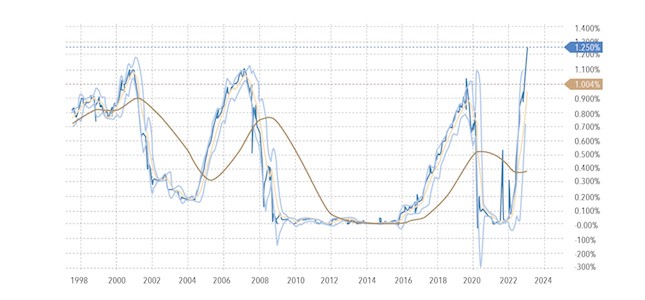
Typically, short-term US Treasury yields are lower than long-term ones. It is natural since their yield accumulates several times during the "long" security period. But now the yield of "short" securities is higher, and the gap has reached record levels.
The current situation means market participants are afraid of abrupt events, possibly a collapse. Note that so far, there has been no experience of a structural crisis in the inflationary scenario with an overheated market. In the 1970s, inflation was low, and there was practically no danger of a collapse in financial markets since the "bubble" did not form. And before that, structural crises were in the situation of the "gold standard", which ruled out inflationary options for their development.
Thus, there was no analogue of the current historical situation, making it very difficult to assess the situation. We cannot refer to analogies, so it is difficult to determine when the market will crash. If the structural crisis develops quite stably and in full accordance with the theory (not liberal, of course; the liberal approach does not recognize structural crises, it has only cyclical ones), then everything is much more complicated with the behavior of the stock market in this situation.


Exhausted?")