The main news of the week was not that the US GDP is falling for the second consecutive quarter — this topic has already been totally kicked around, as soon as preliminary data on the results of the Q2 were collected — but a steady decline of the euro below par value of currencies:
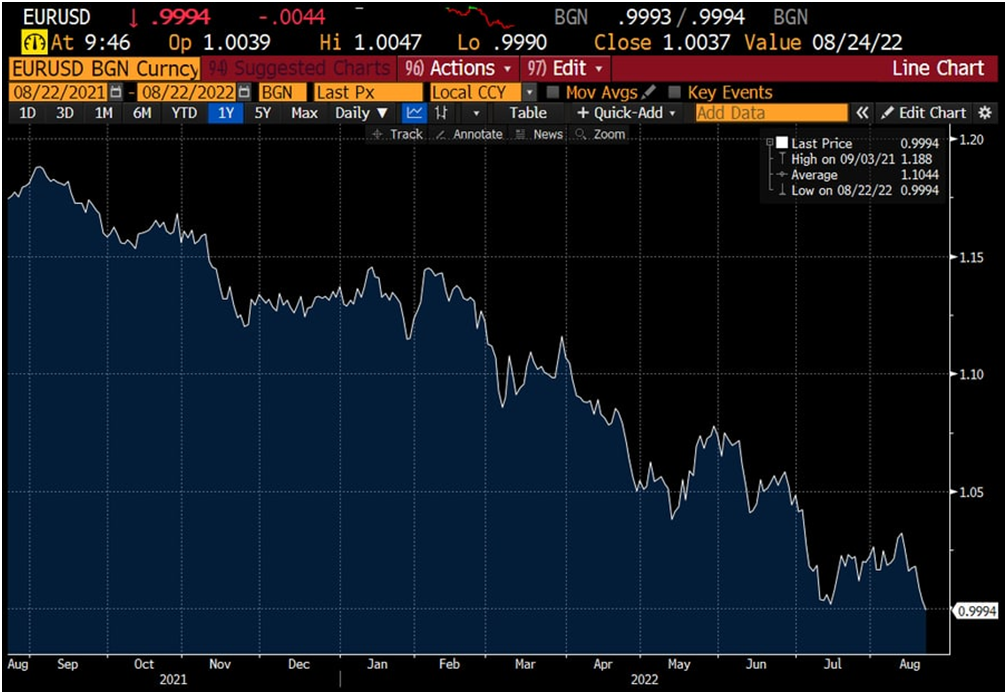
Why is it so important? The fact is that any economic structure (in particular, the world dollar, the Bretton Woods one) has a number of basic proportions. Roughly speaking, the cost of good “A” is about three times the cost of good “B”. It can fluctuate, sometime it will decrease to a twofold increase, sometime it will grow to 3.5, but in general the proportions are quite stable.
The entire world economy is actively counteracting strong deviations from the basic proportions (this is clearly seen in the reaction to major crop failures or similar disasters). And the interaction of the economies of the European Union and the United States within the framework of a stable model of the last 20 years has shown that all attempts to lower the euro ended up with it stubbornly going up.
Today the situation is different. And this means two fundamental phenomena at once. The first is that the United States successfully implemented its’ plan to transfer capital from the Old World to the New one. Well, more precisely, they successfully started this project and there is no reason to believe that they will not continue it. Everything is clear here and we have repeatedly written about this.
But the second thing is that the Bretton Woods model in its “post-Soviet” version, which finally took shape somewhere towards the end of the 90s (that is, at the time of the bombing of Yugoslavia), came to an end. On the one hand, this is not a big problem. For example, we can recall the changes in the early 70s after the US default on August 15, 1971 and the “oil” crisis. On the other hand, there is no alternative model in sight.
At the very least, but then the main mechanism was in operation and made it possible to build new economic institutions and structures, the issue of the dollar. And today, on what resource can an alternative model be built? If you look closely at the policy of the US monetary authorities since 2008, then it has been purely defensive: at any cost to preserve what we have and in no case discuss the fact that this system is collapsing. Constructive proposals are neither within the framework of the official “mainstream”, nor in the darkest lobbies.
Today, the dollar issue is used only to support aggregate demand, but it is still not enough to save the model. This means that the potential for resolving the Breton Woods model in its current incarnation has been exhausted. And for the construction of a new one, as we have already noted, no resource is observed. The collapse of the world into currency zones begins and everyone (not even economists!) understands that the potential of a possible “euro zone” is far inferior to the potential “dollar zones. With all the ensuing consequences.
However, this topic is quite interesting and we will partially continue it in the final section of this review.
Macroeconomics
US GDP showed the 2nd consecutive quarterly loss: US GDP showed the 2nd consecutive quarterly minus –
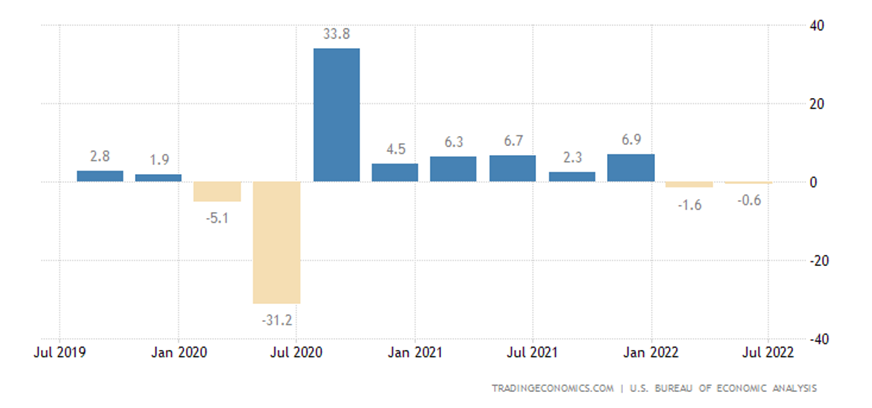
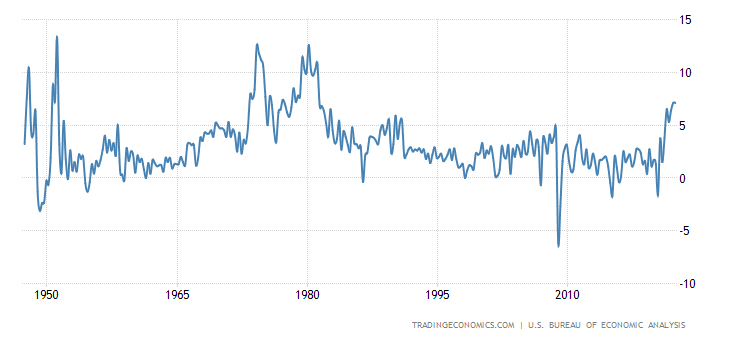
At the same time, the consumer basket price index rose the most in 40 years (+1.8% qoq):
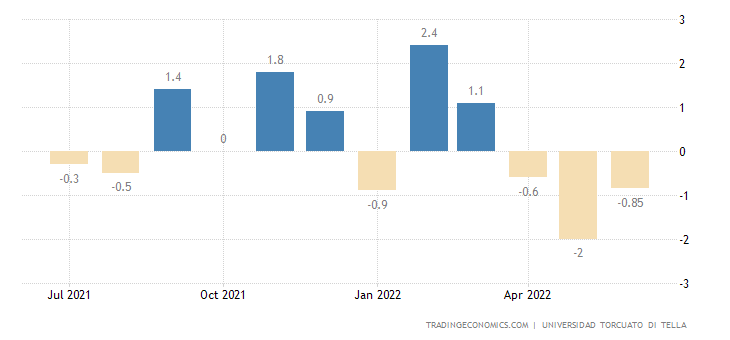
Economic activity in Argentina has been declining for 3 consecutive months:
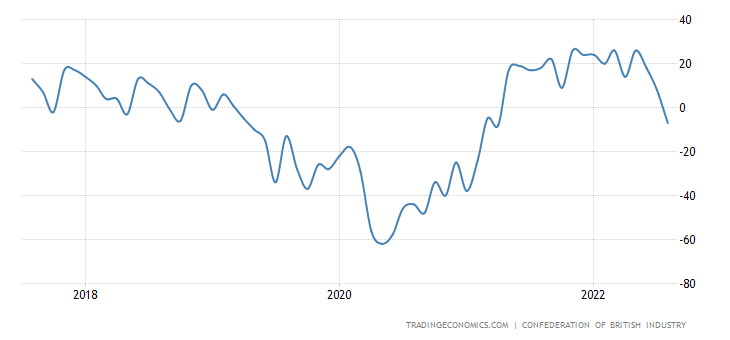
The balance of industrial orders in Britain is the weakest in 1.5 years:
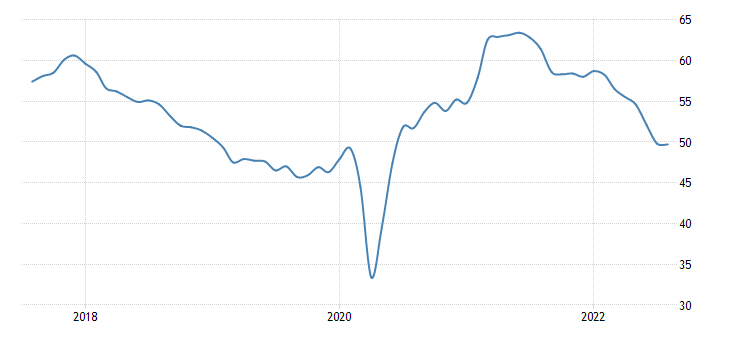
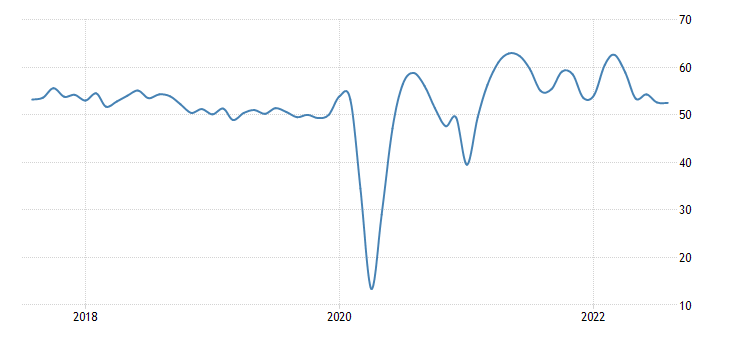
Manufacturing PMI (an expert index of the state of the industry; its value below 50 means stagnation and recession) of Japan is the lowest in 1.5 years:

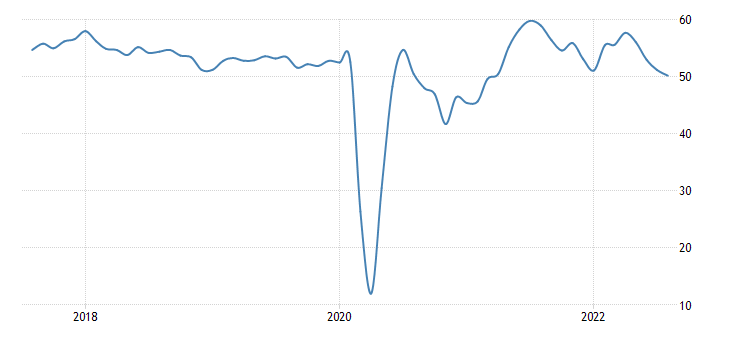
In the euro area – for more than 2 years:
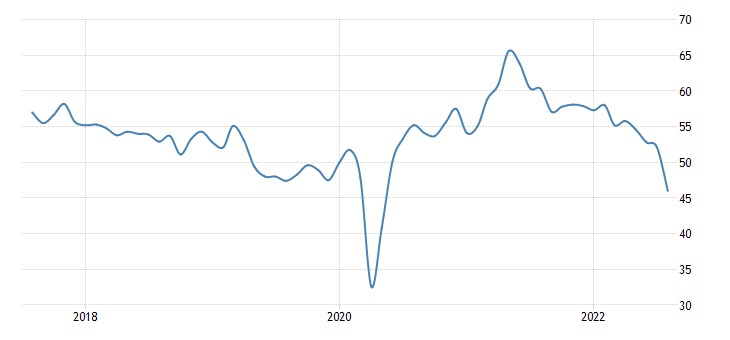
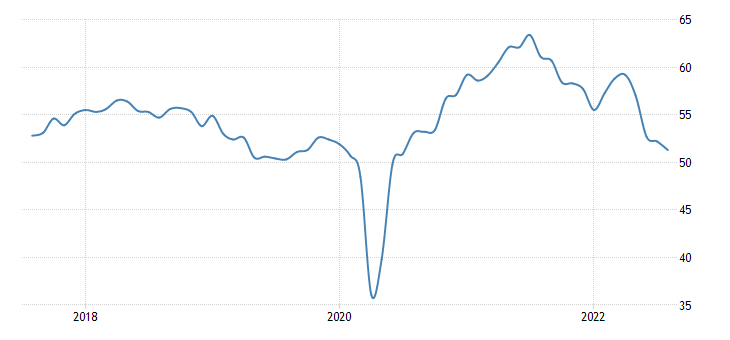
And its service industry is the worst since spring 2021:
In Britain, PMI is not optimistic in all sectors
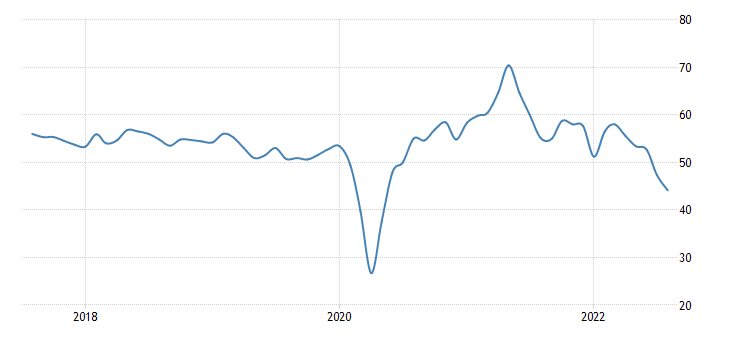
And in the US, the indexes are the weakest in 2 years, and also in both major sectors of the economy:
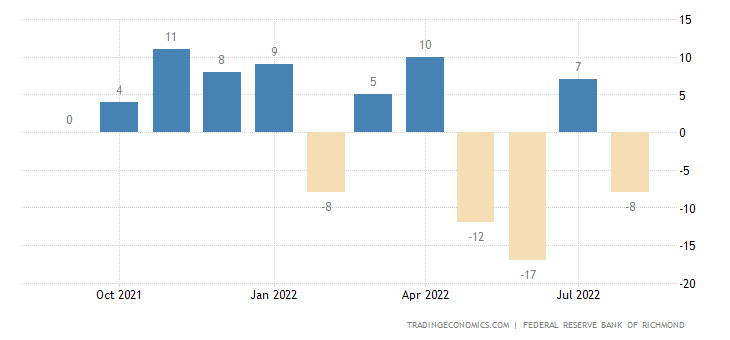
The Richmond Fed index went negative again:
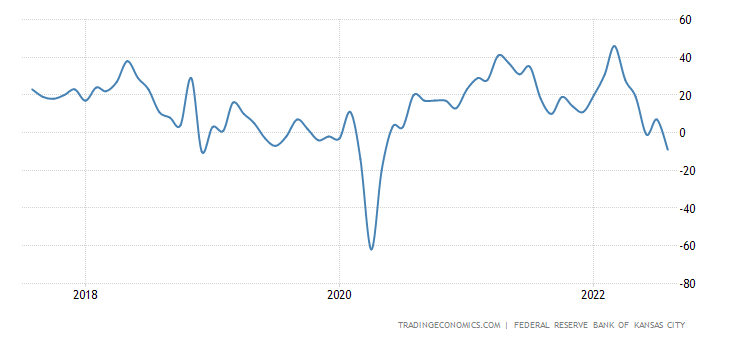
As well as the Kansas Fed index, which has marked the bottom for more than 2 years:
Business Confidence in South Korea at 2 Years Day: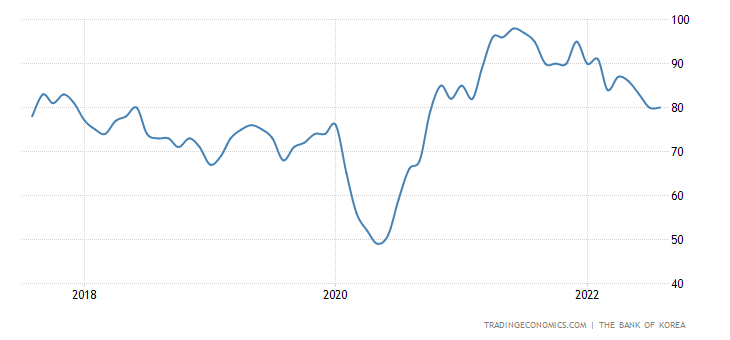
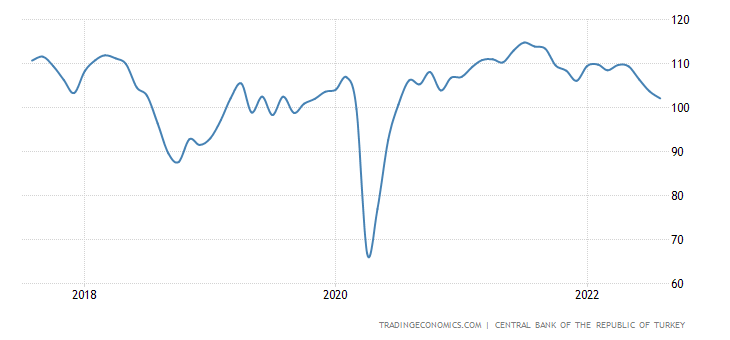
As in Turkey –
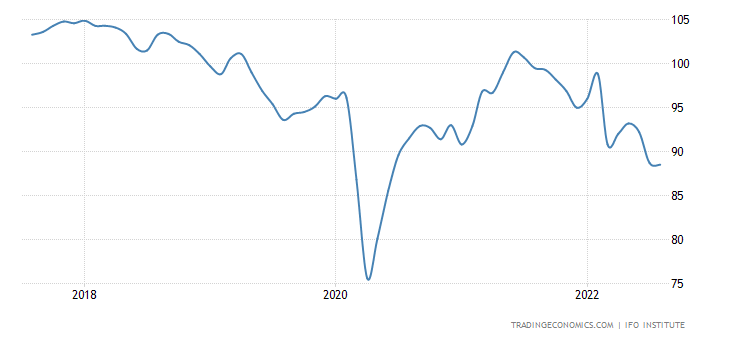
And in Germany (IFO review):
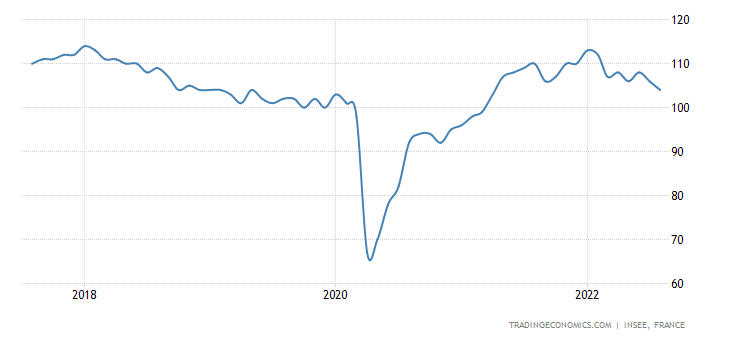
In France – on a 1.5-year:
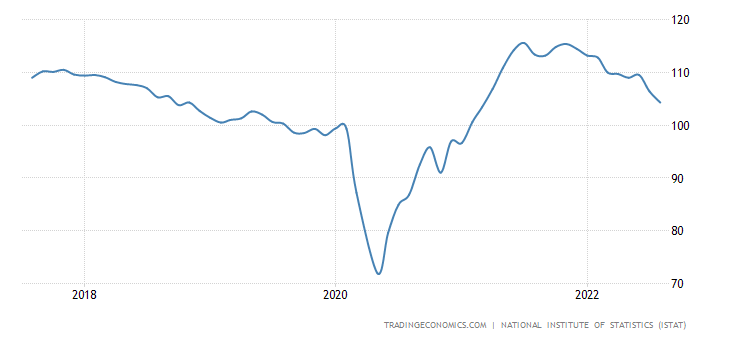
In Italy too:
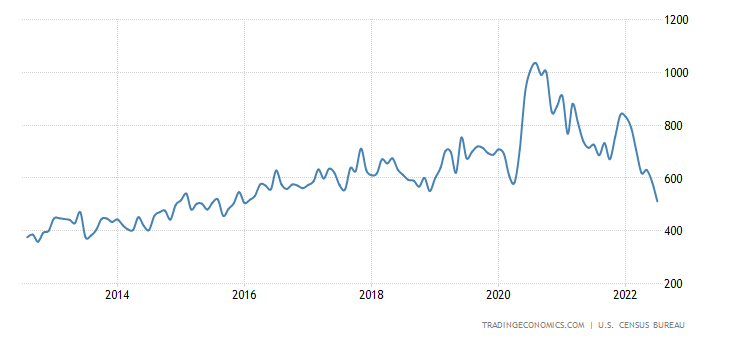
US new home sales have plummeted 12.6% m/m to bottom since January 2016:
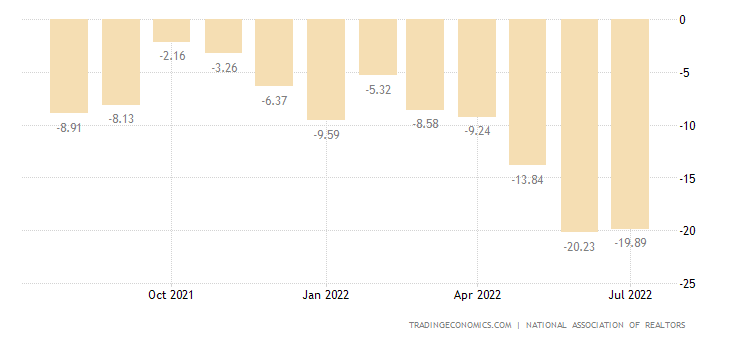
Pending US Existing Home Sales -1.0% per month:
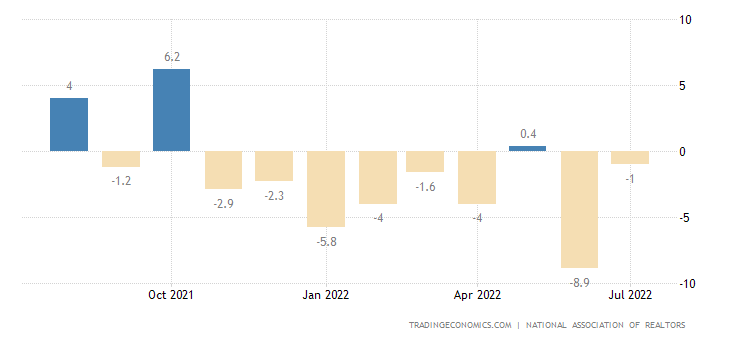
And -19.9% per year:
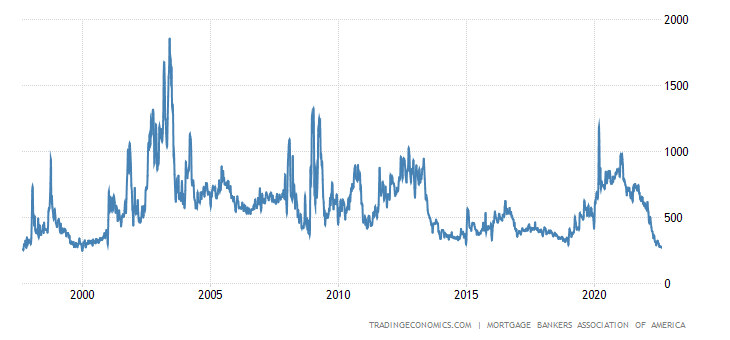
Mortgage applications in the US fell again (-1.2% per week) amid rising interest rates:
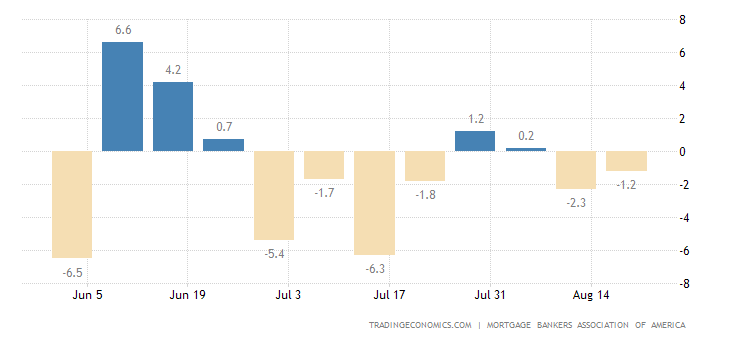
And updated the 22-year low:
Note that the reference to summer does not work here, the data has been seasonally cleared. So, we have a clear sign of falling consumer spending. With all the consequences. CPI (Consumer Inflation Index) South Africa +7.8% per year – maximum since 2009:
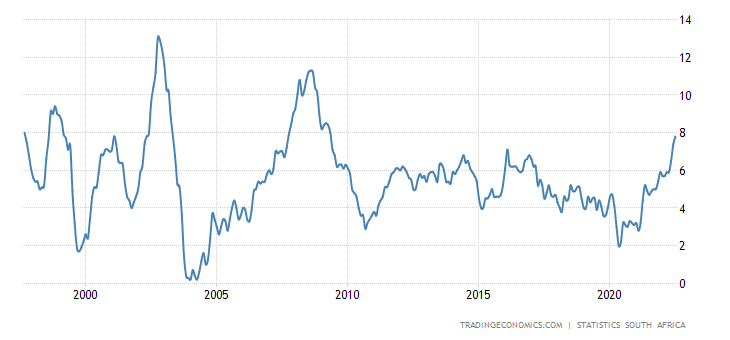
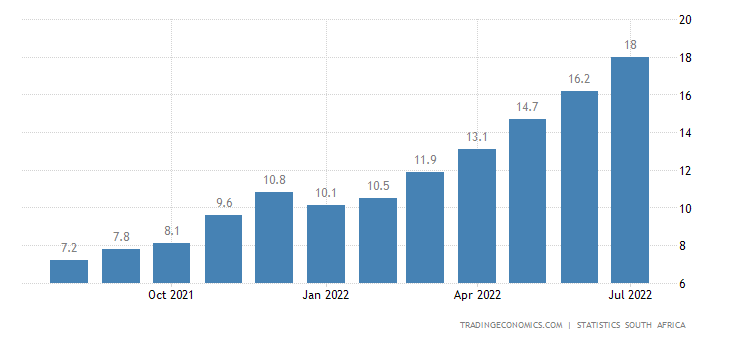
PPI (industrial inflation index) of South Africa +18.0% per year is a record:
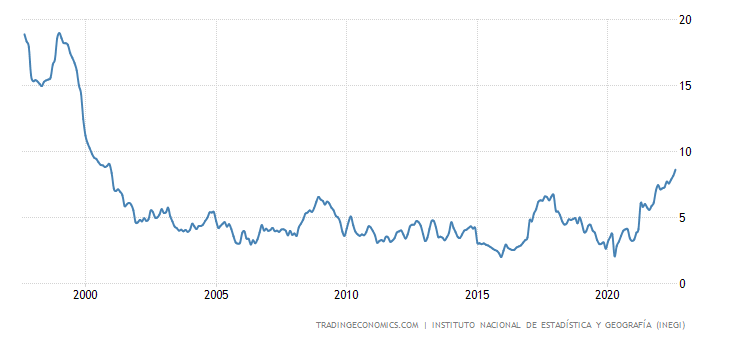
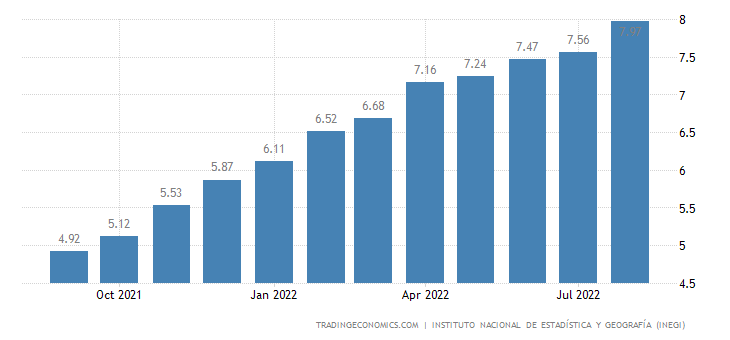
CPI Mexico +8.6% per year – the highest since 2000:
So do the “net” (that is, minus highly volatile indicators for food and fuel) Mexican CPI (+8.0% per year):
Tokyo Prefecture CPI +2.9% per annum – just 0.2% from 30-year peak in 2014:
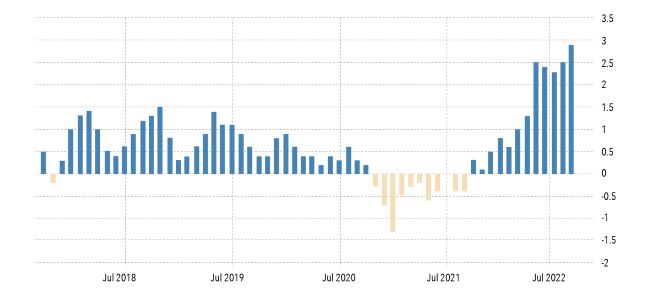
The same with the “net” CPI (+2.6% per year):
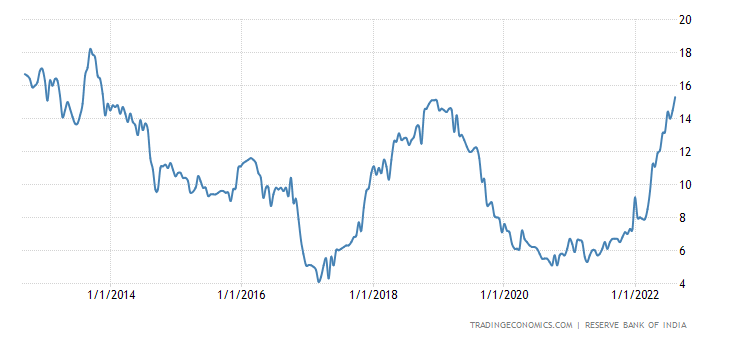
Growth in debt on loans in India (+15.3% per year) is the highest in 9 years:
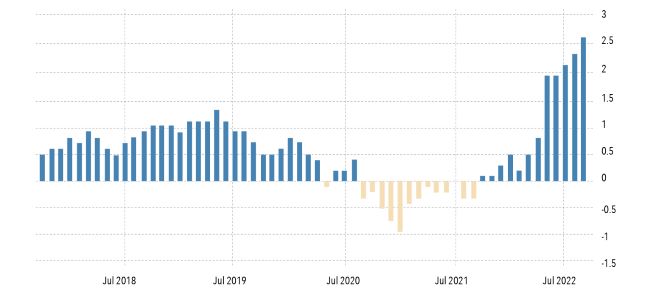
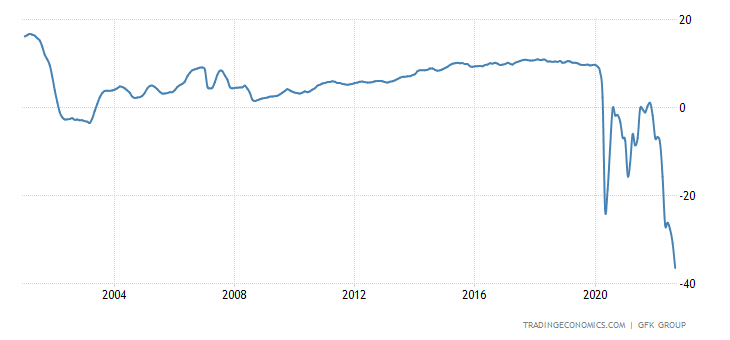
Germans are record pessimistic, propensity to save at its peak in 11 years, desire to consume at its lowest in 14 years:
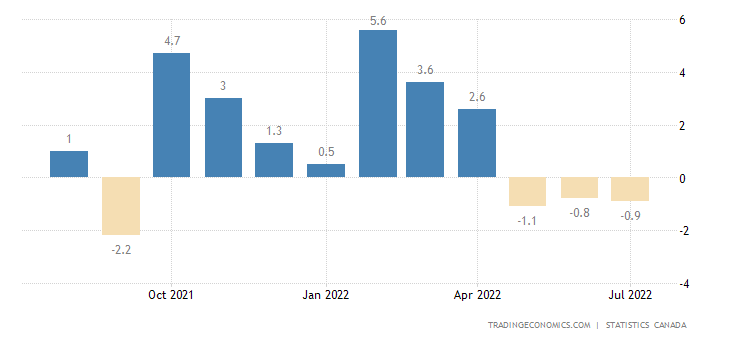
Wholesales in Canada -0.6% per month:
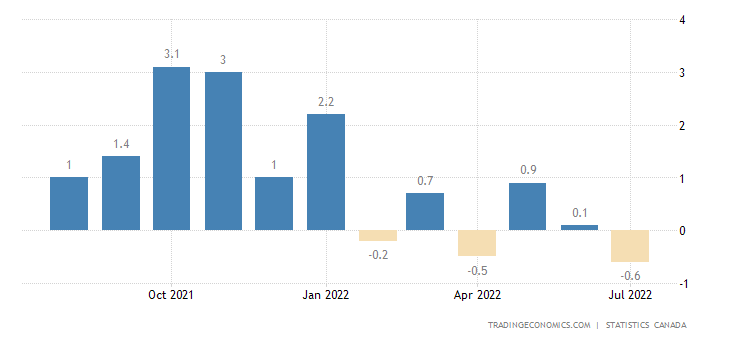
And sales in the manufacturing industry -0.9% – this is the 3rd negative in a row:
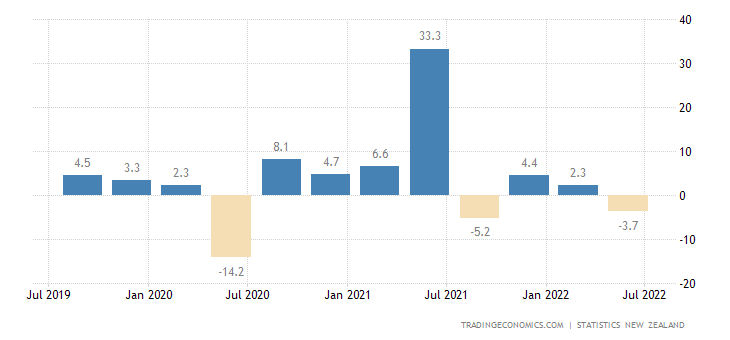
Retail sales in New Zealand fall for 2 quarters in a row:
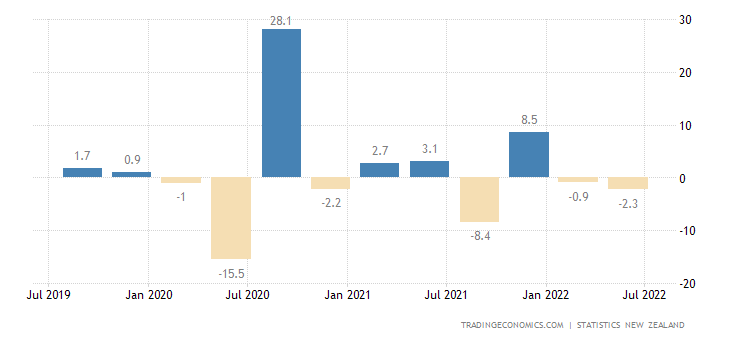
That is why the annual dynamics went into a clear minus (-3.7%):
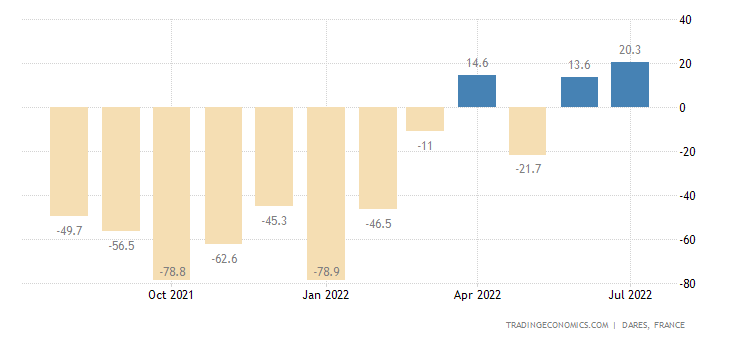
The number of unemployed in France is growing for 2 months in a row:
The Central Bank of China cut the annual rate by 0.05% to 3.65% and the 5-year rate by 0.15% to 4.30%.
The Central Bank of South Korea raised the rate by 0.25% to 2.50%.
The minutes of the last meeting of the ECB showed that it is not going to speed up the process of raising rates.
Main conclusions
As we promised in the first section, here are a few words about the role of the potential “euro zone” in the future world economic system. Let us note right away that today, unlike in 2003, we are extremely pessimistic about the likelihood of the sustainable existence of such a zone. But as long as the EU exists, therefore the “proto-currency” euro zone really exists. And it adapts significantly during the crisis.
Within the framework of the Bretton Woods model, if the EU secured a fairly comfortable existence for itself within the framework of the “cheap import of raw materials – average labor – export of expensive technological products” model, then this system will not work under the new conditions. The quarrel with Russia and the countries of Southeast Asia (it does not matter for what reason) deprived the EU of cheap raw materials, and the fall in aggregate demand in the world (as part of the regular development of a structural crisis) led to a reduction in exports.
Accordingly, the trade balance deficit grew (we have noted this more than once) and the source of domestic development has disappeared. It is for this reason that the increase in gas prices is so significant – it is a symbol of the collapse of the previously existing economic model. The completely comfortable state of an enclave within the dollar zone is changing to the need to exist within the framework of self-sufficient economic mechanisms, and they can be sustainable only with a sharp drop in living standards within the EU. And given the extreme political instability of this entity, it has few chances to survive.
An important event was the speech of Fed Chairman Jerome Powell at the traditional Fed conference in Jackson Hole in the evening Moscow time. This speech was expected by the markets as very important, but, as we suspected, nothing fundamental was said. Key quotes:
- “The Fed may slow down the key rate hike “at some point”
- The longer high inflation persists, the more likely it is to take hold
- The Fed is looking to cut demand to better match supply. The labor market is noticeably strong, but not balanced.
- The lower inflation figures in July were encouraging. But they do not meet the conditions under which the Fed will confirm the slowdown in inflation.
- The Fed is purposefully pushing policy toward a “restrictive enough level” to bring inflation back to 2%.
- A rate of 2.25-2.5% is not “pause room”. These are the unfortunate costs of inflation. But failure to restore price stability would have been even more painful.
- Lowering inflation is likely to require an extended period of sub-trend markets. Restoring price stability will require maintaining a tight monetary policy for some time.
- The main goal of the Fed is to ease inflation. Restoring price stability will take time and tough monetary policy action. The Central Bank will continue to act until inflation is brought under control.
- The Fed’s rate should reach an activity-limiting level and stay there for a while. This could weaken the labor market and create some problems for households and businesses”
The reason for this situation is that the US monetary authorities (unlike us) do not understand the mechanisms of the crisis, that the crisis continues, that it is necessary to stop emission in order to reduce inflation, and it must be continued to preserve household income.
What does all this mean strategically? The real per capita disposable income of American households in July 2022 is 1.5% lower than it was before the start of the quarantine emission (since March 2020).
The income graph clearly shows the effect of “helicopter” money in 2020-2021 and the complete zeroing of the “perpetual motion machine” from 2022. Excluding transactions with the state pre-tax real income has stagnated for almost two years since October 2020, which indicates a complete lack of progress in the development of the private sector .
The real per capita spending of the US population has been stagnating since February 2021. i.e., almost a year and a half with a downward trend since February 2022. But despite all the incentives, debt growth and exorbitant imbalances in the system, the cumulative effect over 2.5 years was only 1.5% (change in real per capita expenditure from February 2022 to July 2022).
Income is lower and expenses are higher – why? The savings rate has fallen to a 15-year low since 2008-2009, now about 5% against an average of 7.4% from 2012 to 2019. With the scattering of “helicopter” money, the savings rate at the moment increased to 34% with an annual average of 19%.
The collapse of real incomes is associated with the disabling of programs to support the population. In July, net state support in the income of the population was minus 5.7% against the average annual plus 6% in mid-2021 and minus 3.3% from 2012 to 2019.
Budget policy has become much tougher than it was in the last 10 years, but this is due to the fact that the budget is simply cut off from access to the open market and it has the ability to make large borrowings. Only through emission. And it is clear that as GDP declines (recall, all the data here are given on the basis of an analysis of official figures, that is, with underestimated inflation), state support for households will decrease, with all the attendant consequences.
Well, we will monitor the situation with inflation as carefully as possible, especially considering that, within the framework of a changing economic model, its basic indicators may change. If cumulative industrial inflation has fluctuated around 20% since September 2021, then it is possible that it will reach some other stable indicator.


Exhausted?")