The main news is the complete refusal of the British ruling elite to discuss the program of the new prime minister. It seems that no one is interested in this issue at all.
It would be nice if the situation with the economy would improve, but there is nothing even close to that. The case is developing rapidly, which means that the "the powerful of this world" have no idea about what is happening and what to do with it. Theoretically, it is not the first time this conclusion has been drawn, but every time there is hope that some glimpses of thought will arise among the ruling elites. So far, this hope has not been justified.
In the US, the picture is similar. But here, at least one can refer to the elections, which are only a week and a half away. As the economic situation worsens in the US, the Biden administration does not want to draw attention to it, and the Republican Party does not want to ease the pressure on the Democratic Party by moving to a constructive style. Aggressive bawdry is much more effective here.
Macroeconomics
Chinese data for September is mixed. GDP, investment and industrial production accelerated; but retail has slowed, unemployment has risen, and new home prices are falling at the worst rate in 7 years.
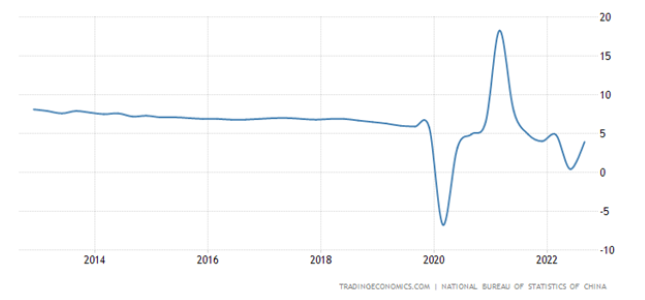
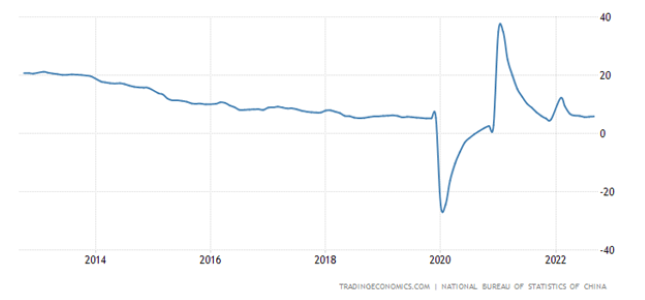
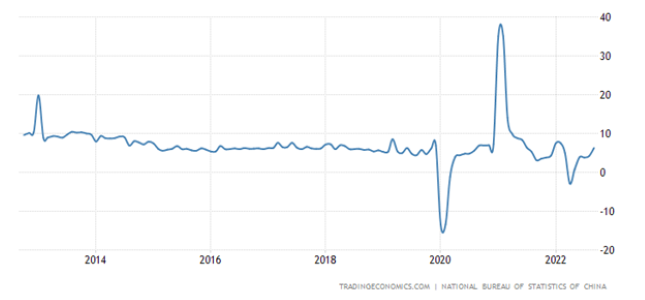

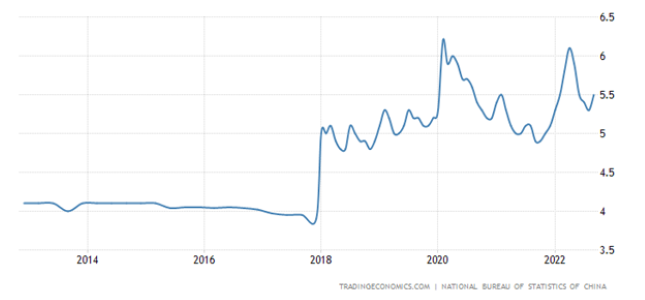
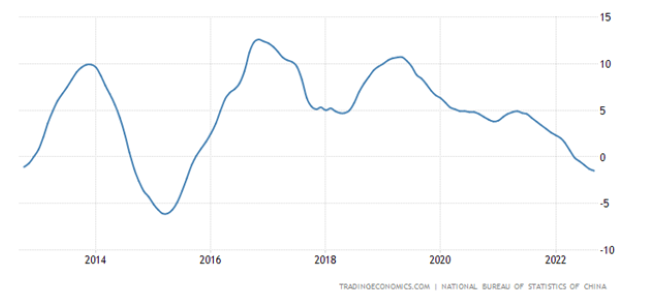
Since economic statistics in China have an extremely complex relationship to reality, only relative changes can be commented on. And even then, not always. In this case the Chinese authorities are forced to recognize some negative phenomena, which is quite significant. The analysis of the situation shows that in China, there is a "bomb" under the economy in the form of domestic subsidies of 25% of GDP (by the way, the picture is similar in the USA). And therefore, we are waiting for negative processes, but it is rather challenging to determine how they develop in reality.
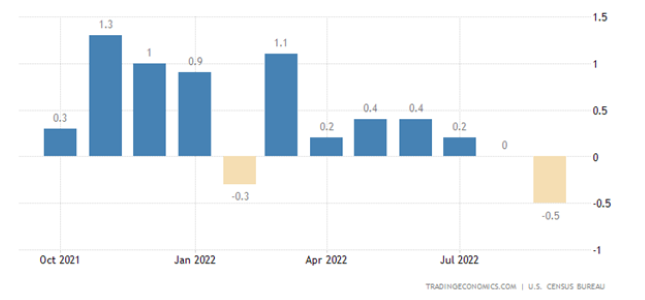
Orders for durable goods in the US without the transport sector do not grow for 2 months in a row:
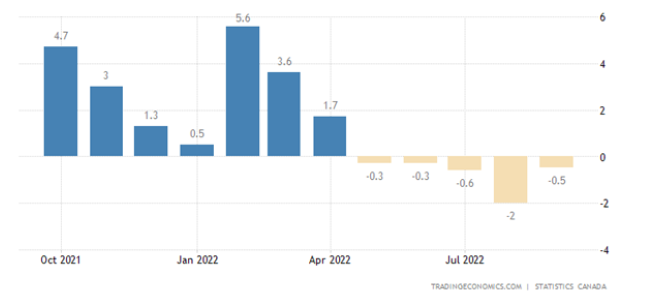
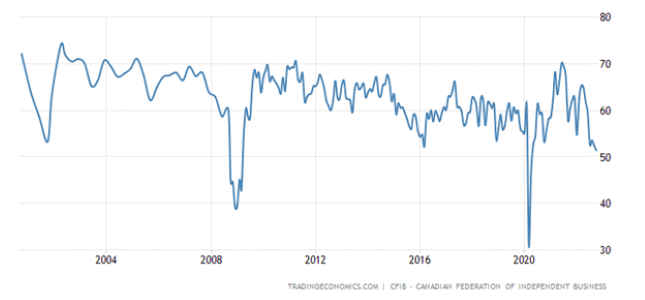
Canadian manufacturing sales (-0.5% m/m) fall for 5 consecutive months:
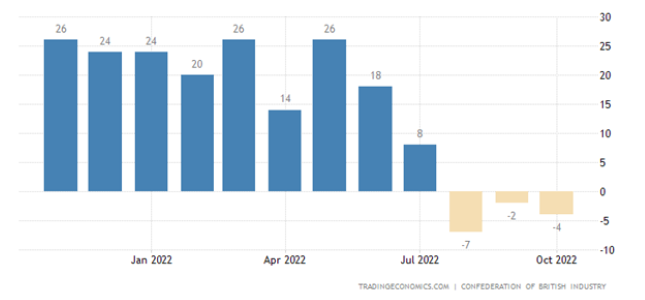
The balance of industrial orders in Britain keeps in the red for 3 months in a row:
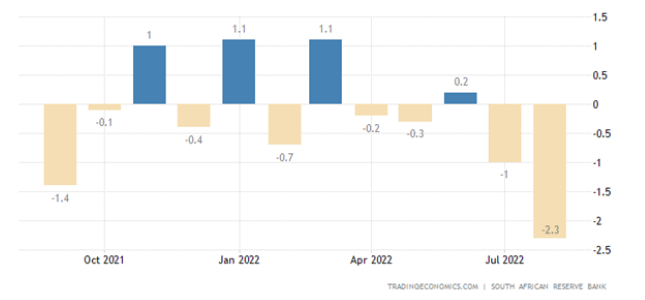
Leading indicators of the business cycle in South Africa are declining for 2 months in a row:
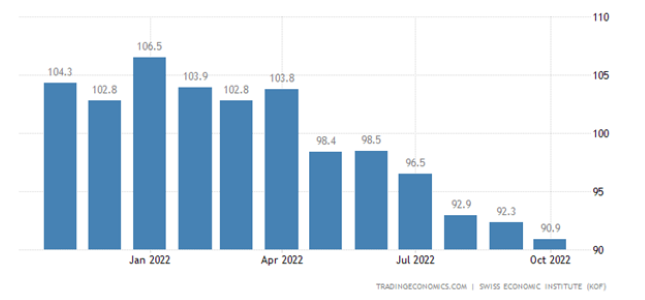
In Switzerland, they have been below long-term averages for 6 consecutive months:
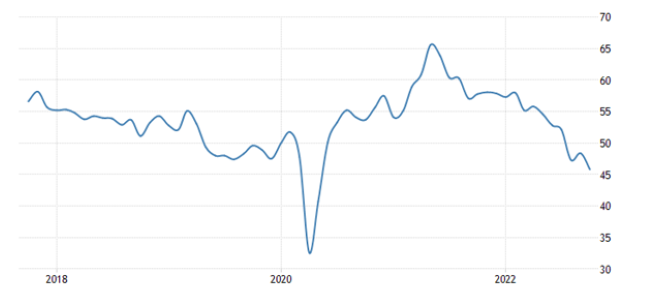
PMI (expert index of the state of the industry; its value below 50 means stagnation and recession) of the eurozone industry is declining the most in 2.5 years (46.6):
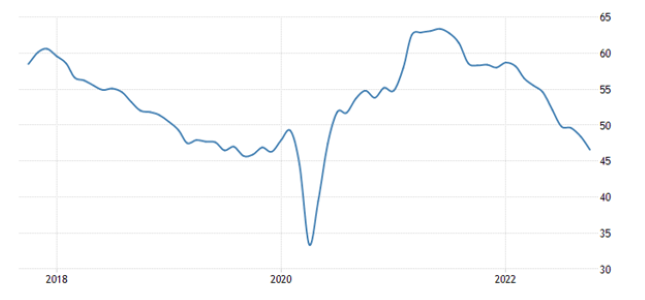
And PMI of the service sector – for 20 months (48.2):
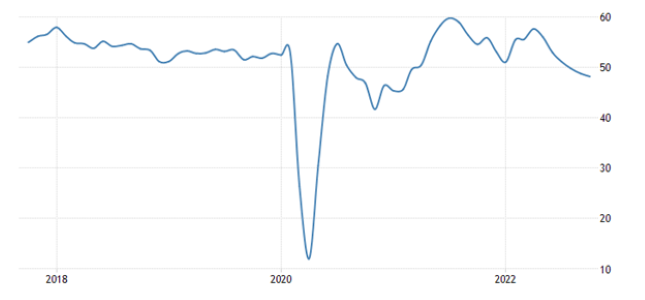
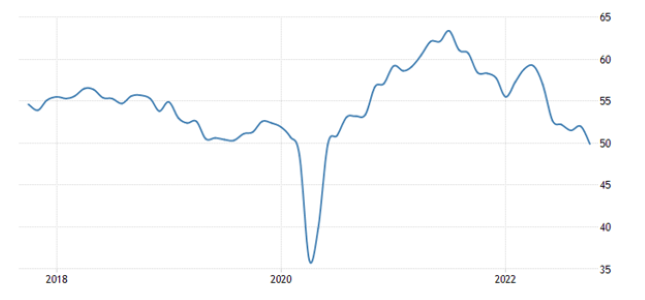
The same picture in Britain (45.8 and 47.5):
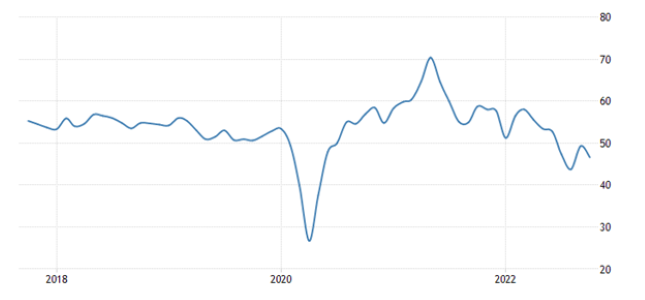
For the first time in 28 months, the PMI of the US industry (49.9) went into the recession zone:
And their service industry went deep into this zone (46.6):
From this point of view, preliminary data on GDP in the III quarter of this year (2.6%) seem to be disputable. The economic situation is clearly not improving. Why should GDP grow? However, this is discussed in the last section of the Review.
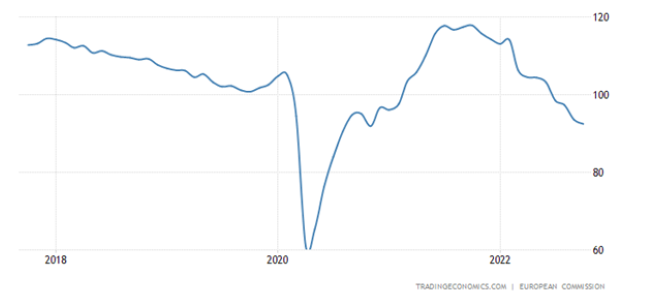
Economic sentiment in the eurozone is the darkest in 2 years:
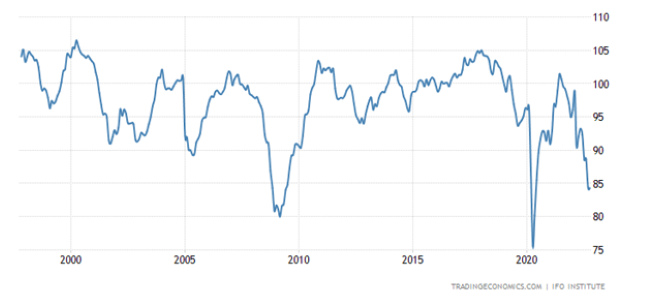
The IFO business climate index in Germany, apart from the covid failure of 2020, is at the bottom since 2009:
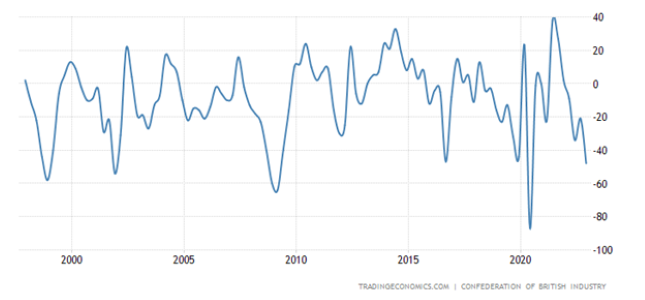
The picture is the same for business optimism in Britain:
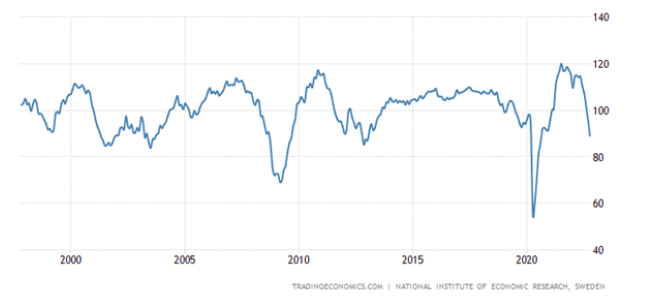
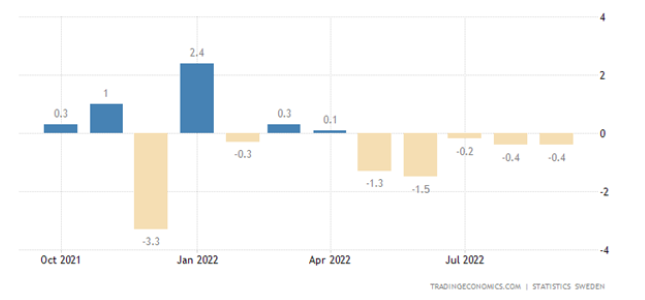
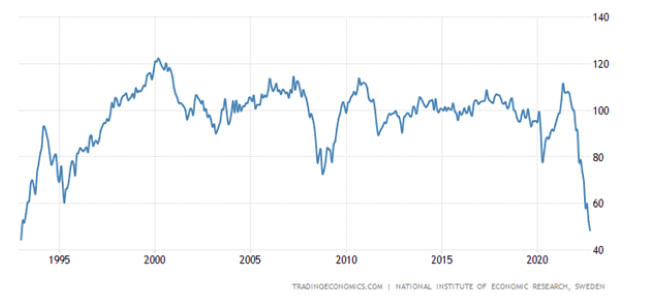
Similar situation in Sweden:
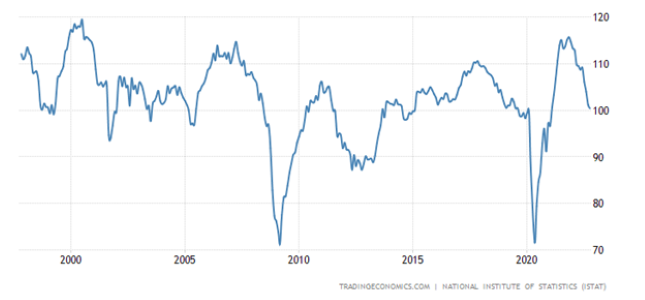
In Italy, business sentiment is at the bottom since January 2021:
In Canada – from April 2020, and before that – from 2009:
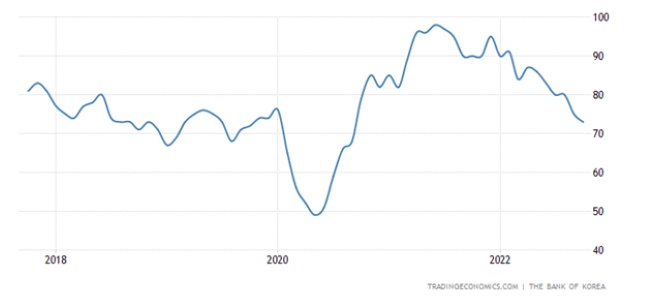
Business confidence in South Korea at least 2 years:
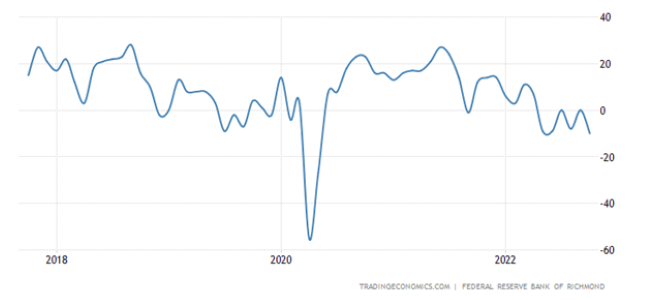
The index of industry activity in the Richmond Fed zone is the worst in 2.5 years, does not go into plus for 6 months in a row:
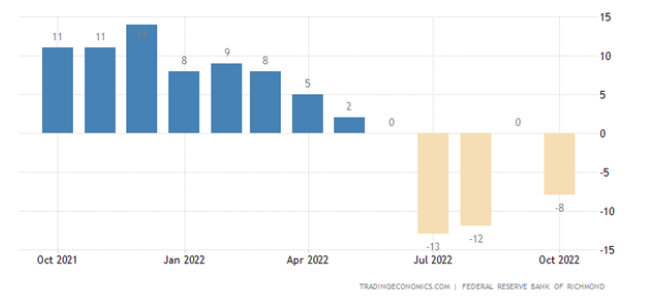
The indicator of the services sector of the same region is negative for 5 months in a row:
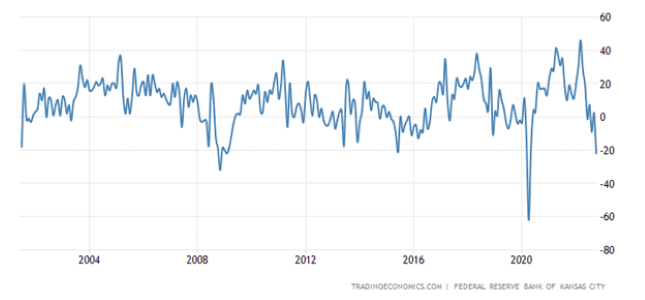
The Kansas Fed has a similar picture – the bottom in 2.5 years, and before that, similar numbers were in 2009:
Sales of new buildings in the USA -10.9% per month:
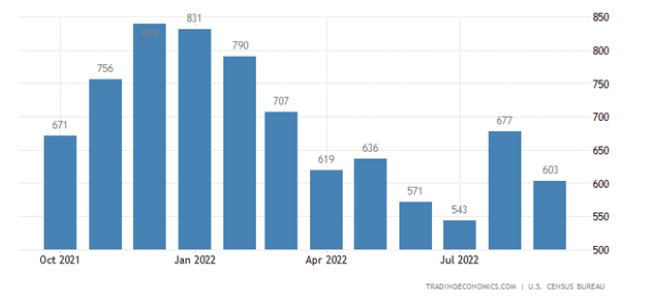
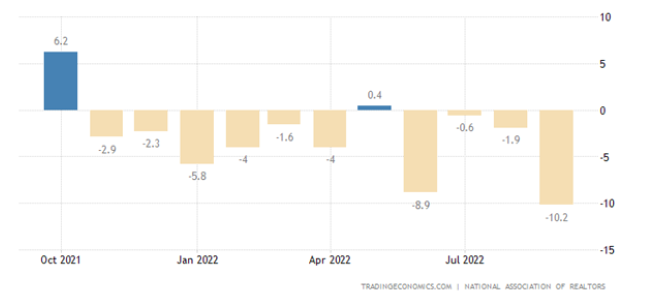
U.S. pending existing home sales -10.2% per month – 10th negative in the last 11 months:
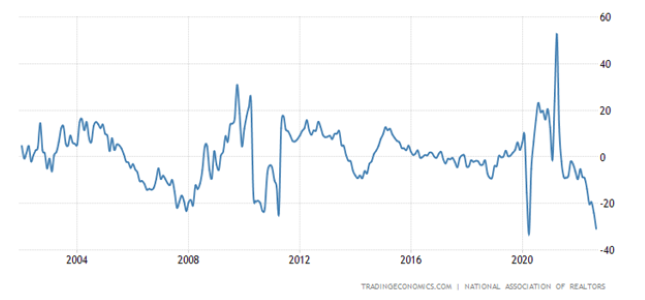
And -31% per year – almost a record decline; sales at record lows in 2010 and 2020:
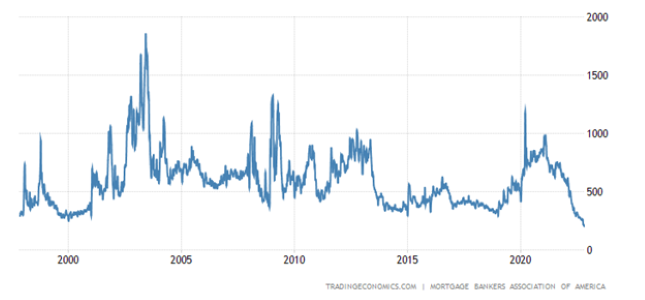
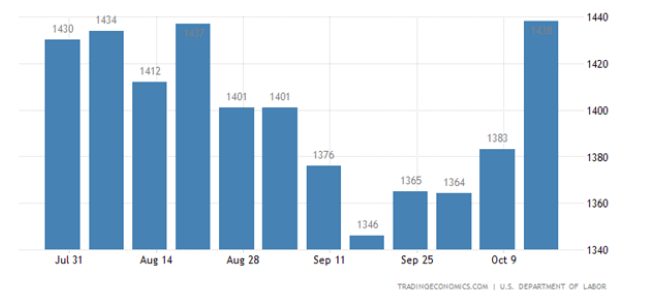
Mortgage applications in the US another -1.7% per week – the 5th negative in a row and the 10th in the last 11 weeks:
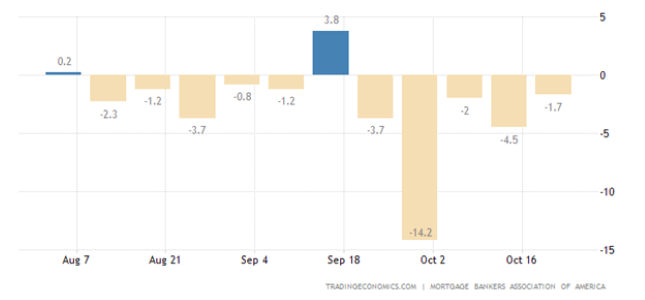
Thus, they updated the 25-year low:
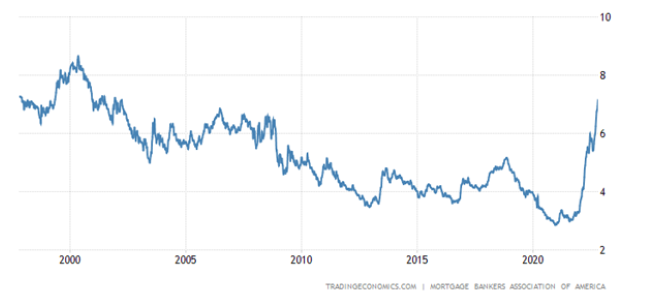
Against the backdrop of a rise in loan rates to the top since 2001 (7.16% for 30-year loans):
Prices for single-family houses in the United States, according to officialdom, -0.7% per month – the worst dynamics since 2011:
And according to S&P/Case-Shiller, even since 2009 (-1.6% per month):
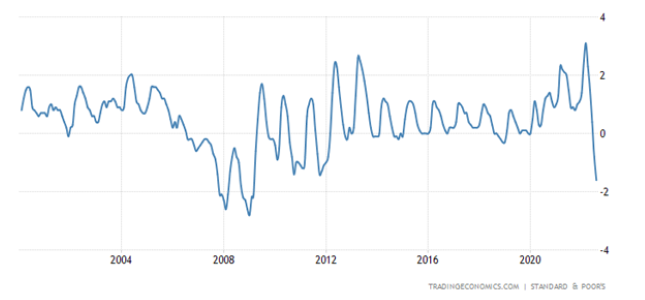
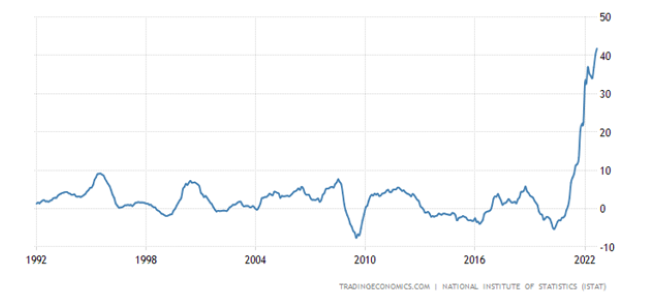
PPI (industrial inflation index) Italy +41.8% per year – a record for 31 years of data collection:
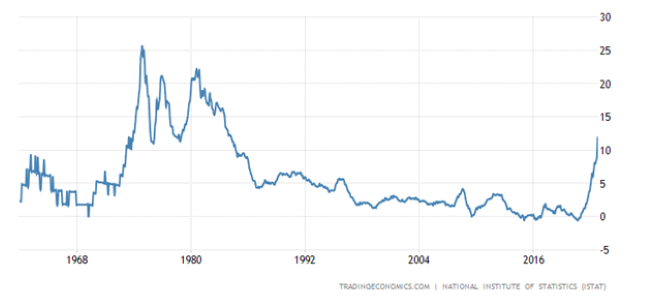
Italian CPI (Consumer Inflation Index) +11.9% per year – 38-year high:
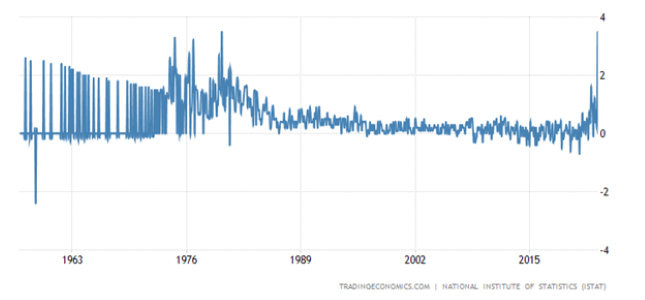
And +3.5% per month – an unprecedented surge in history:
Australian PPI +1.9% qoq – 25-year record:
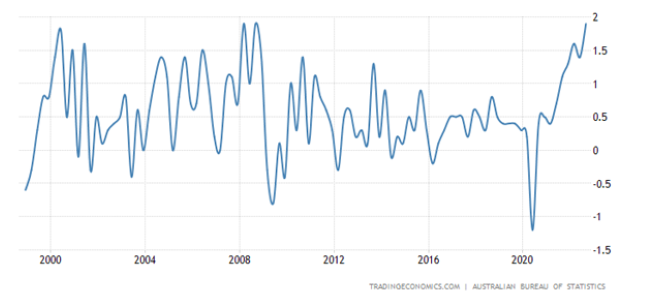
And +6.4% per year is also a record:
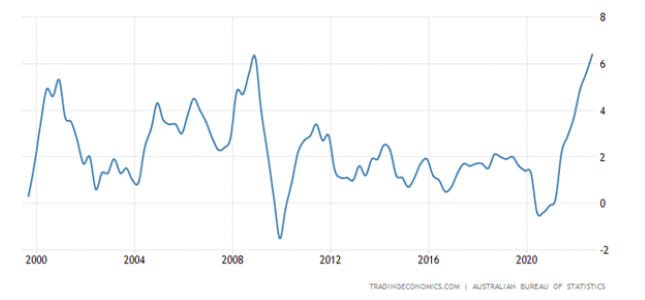
CPI Australia +7.3% per year – the highest since 1990:
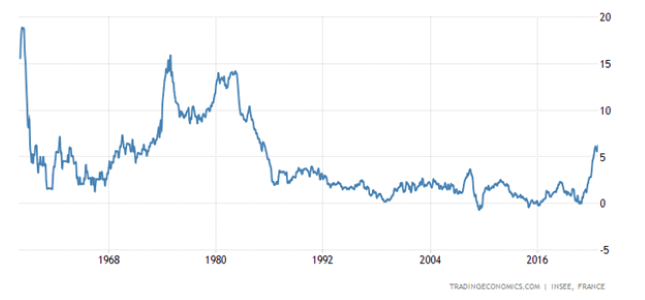
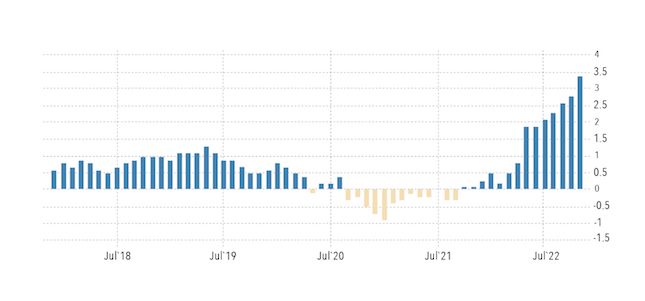
French CPI +6.2% per annum – the highest since 1985:
German CPI +10.4% per year – peak since 1951:
Tokyo Prefecture CPI in Japan +3.5% per annum – the highest since 1991:
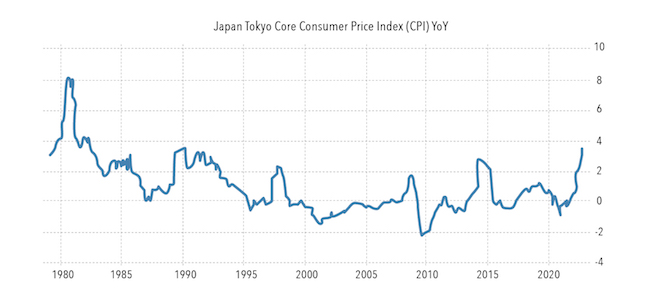
Without fresh food +3.4% per year – the peak since 1990 and only 0.1% to a 40-year high:
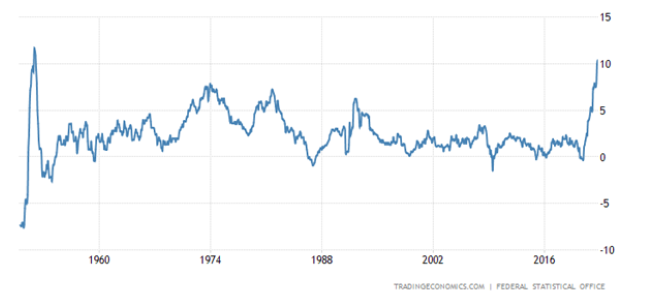
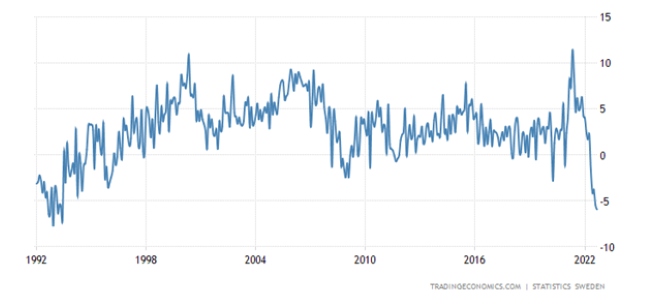
Annual lending growth in Sweden (+5.1%) is approaching a 25-year low:
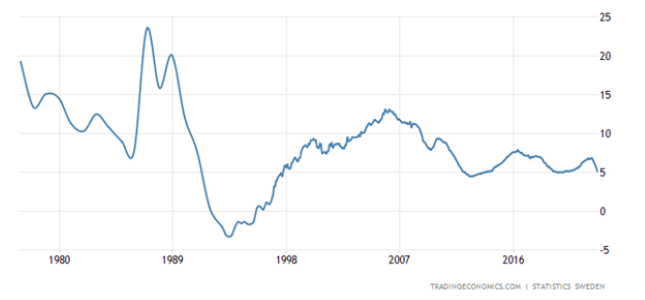
Retail Sweden -0.4% per month – 5th negative in a row:
And -5.9% per year – also the 5th negative in a row and the worst decline since 1993:
U.S. Unemployment Benefit Recipients Highest in More Than Six Months:
The mood of the Germans remains near the records of pessimism:
The Swedes are just as gloomy:
Italian confidence is worst in 10 years:
The ECB raised the interest rate by 0.75% to 2.00% and intended to continue tightening the policy. The Central Bank of Canada increased the rate by 0.50% to 3.75% – less than expected +0.75%. The Central Bank of Brazil did not change anything against rapidly decelerating inflation. The Bank of Japan left rates at -0.1% and will continue buying unlimited government bonds.
Main conclusions
In some countries (Brazil), deflationary tendencies are beginning to appear. In the United States, it has not yet come to this. Moreover, the tightening of the policy is accompanied by the continued pumping of the economy with cash. In September, a record widening budget deficit was set, $430 billion in one month, compared to deficits of $65 billion in 2021 and $125 billion in 2020, when everyone was supported indiscriminately.
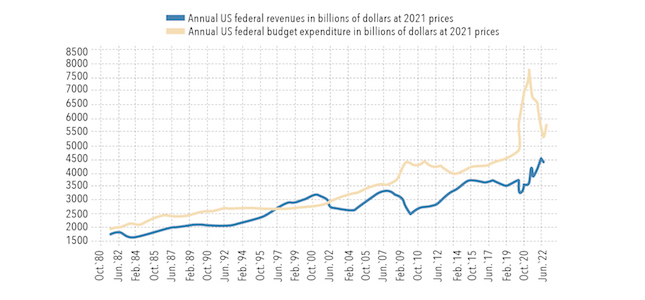
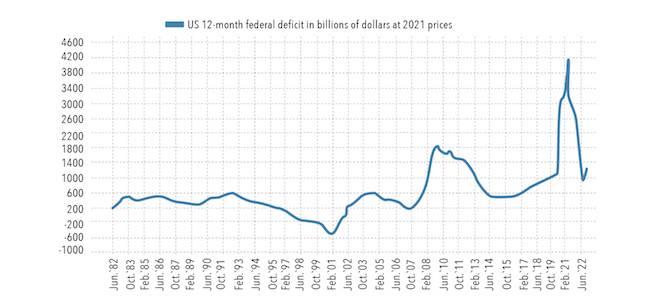
In general, the third quarter was terrible for the budget. The anti-record of 2021 was updated with a significant "overweight" when a deficit of 537 billion was set and much higher than in 2020 when it was 387 billion. This time a deficit of 861 billion was shown.
The annual deficit narrowed from March 2021 to July 2022, when it bottomed out at $962 billion and rose sharply to almost $1.4 trillion by September. The US tried to "live within its means" until mid-summer, but it didn't work out; after the fall in stock markets, they returned to monetary pumping.
At the same time, if we consider inflation (not even accurate, but official), the picture looks slightly different. The total money supply is declining:
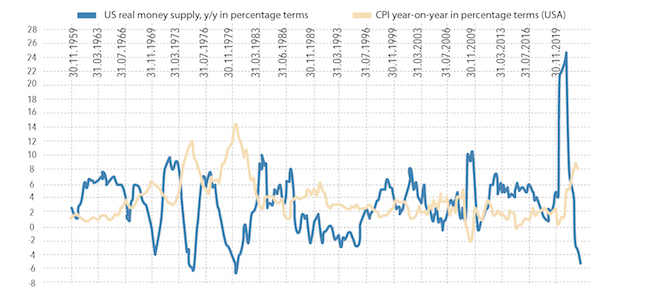
Since January 1, 2022, the money supply at par has not changed – 21503 billion for September against 21490 billion for December 2021. A reduction of 5.54% for nine months, adjusted for inflation, repeats the anti-record of May 1980 (minus 5.7% for nine months), so the current reduction in money supply is one of the strongest in US history!
This picture means that the banking system is less and less efficient. The structure of the money supply is degrading. The economy is being simplified. In such a situation, the impact of cash surges only spins up inflation more.
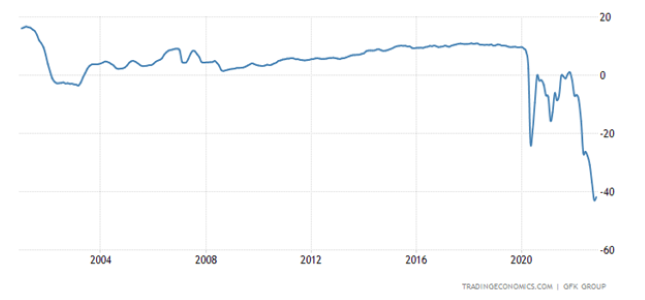
At the same time, savings also fall. The official data is shown in the chart below. In reality, the picture may be even worse. Recall that the real level of savings before the 2008 crisis was -5%, so, most likely, official statistics overestimate savings rates by 8%.
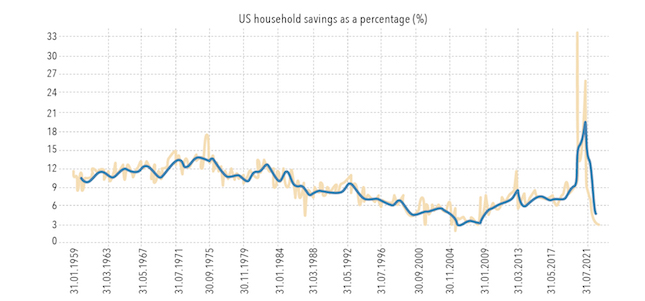
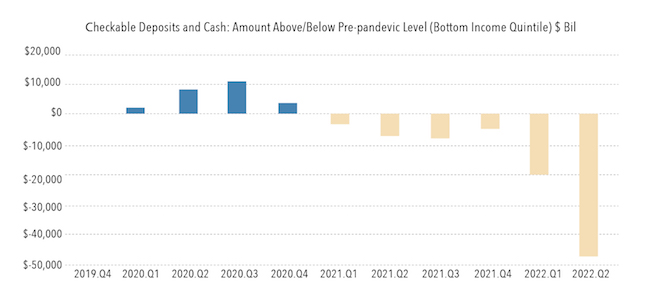
There is another picture, the quarterly savings of the bottom 20% of US citizens, which is even more convincing:
Usually, during a crisis, savings grow. Now there is clearly a crisis situation, but savings are declining. It means that the guidelines for adequate economic behaviour among citizens are lost, which often means the threshold of panic.
In general, it can be noted that there is a discrepancy between different models of behaviour in a crisis, and this discrepancy concerns not only households but also corporations and the state. And if the picture does not change after the election, the entire US economic system has reached the threshold of a big collapse.


Exhausted?")