1. Global energy consumption
This section of the global energy analysis is based on data on global primary energy consumption published by BP in the 2022 bp Statistical Review of World Energy. In addition, data from the UN, the IMF, and other sources on population and GDP were used.
1.1. Annual consumption of primary energy in the world from 2007 to 2021
The global oil industry has emerged in the 19th century. Mankind started consuming increasingly more primary energy, due to the growth of oil production and the development of new sources of primary energy. However, at the beginning of the 21st century, over the escalating economic and social problems aggravated by military operations and the sanctions policy of the United States and its satellites, international economic cooperation began to collapse, which hampered the growth rate of energy consumption.
FIG.1
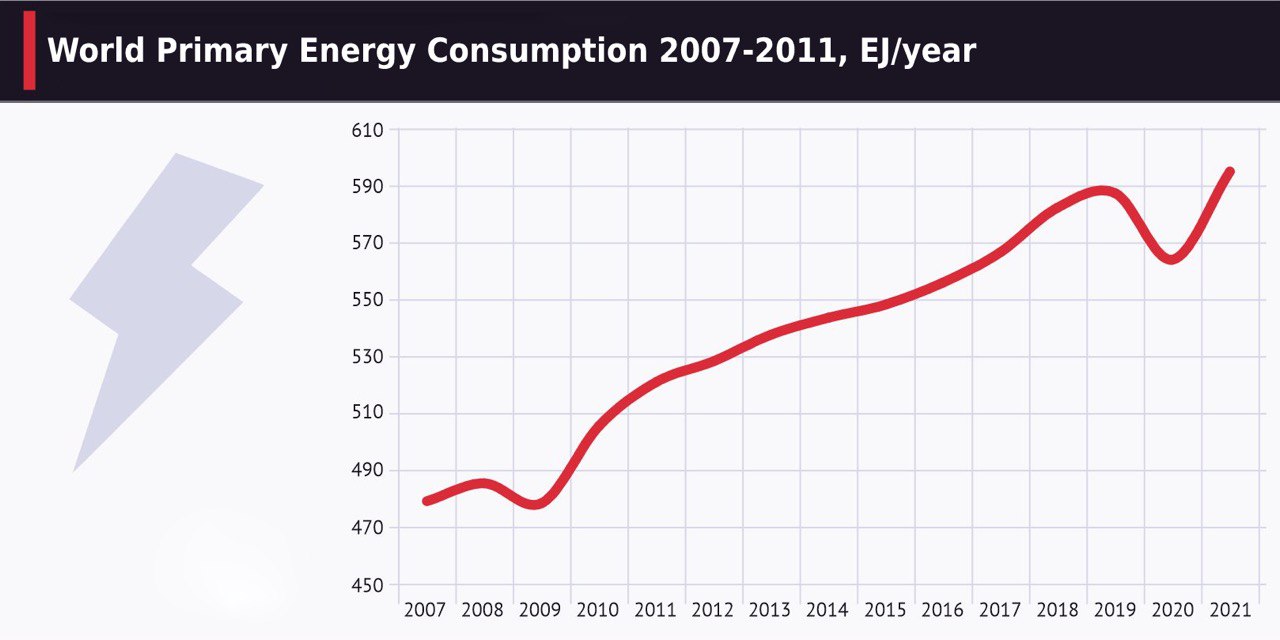
Fig. 1 shows a graph of world energy consumption changes between 2007 and 2021. The graph clearly shows the minima of energy consumption. In 2009, the drop was caused by the 2008 economic crisis. In 2020, by the COVID-19 pandemic that began in 2019.
At the beginning of the 21st century, it became obvious that the United States was no longer the only world leader. In terms of such indicators as the availability of primary energy sources and mineral deposits, the production of food and industrial products, scientific potential, modern types of weapons and manned space programmes, China and Russia joined the USA as the world leaders. Fig. 2 shows the dynamics of primary energy consumption by the countries in the period from 2007 to 2021.
FIG.2
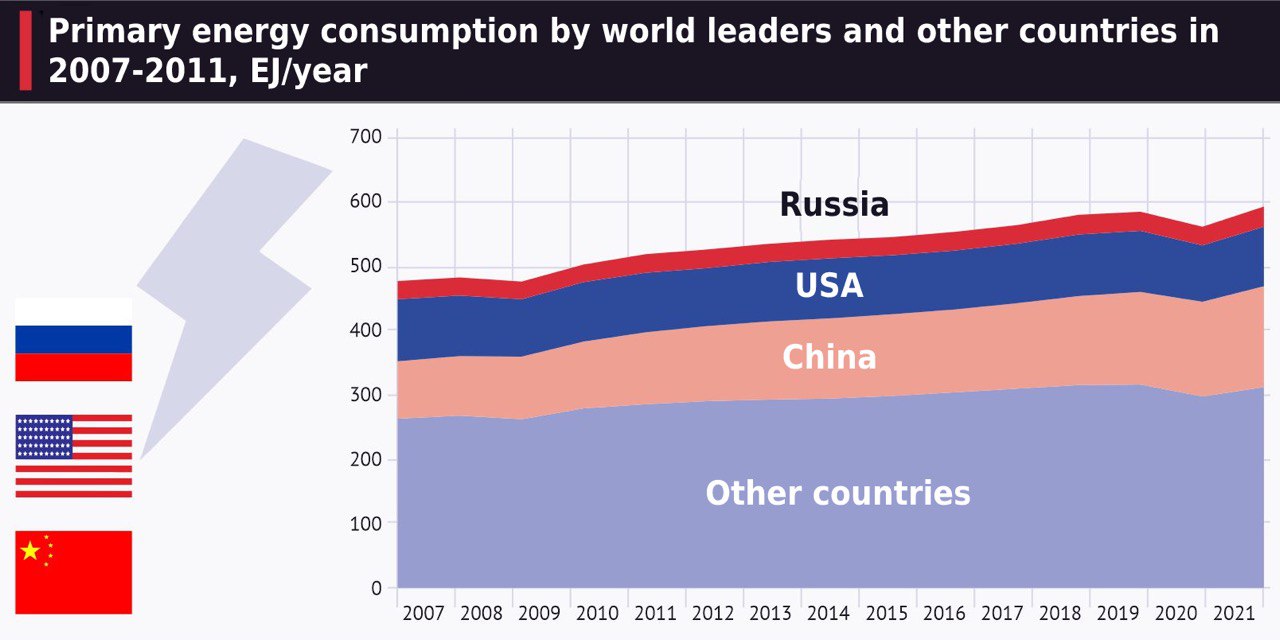
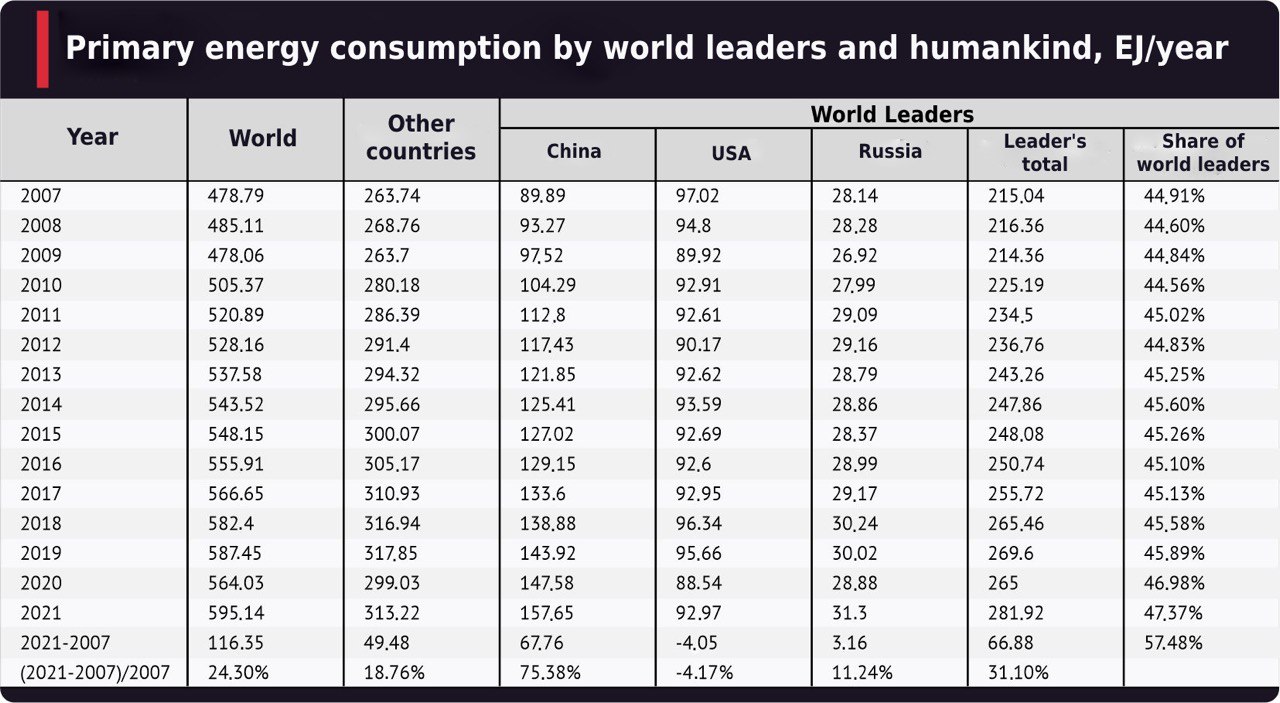
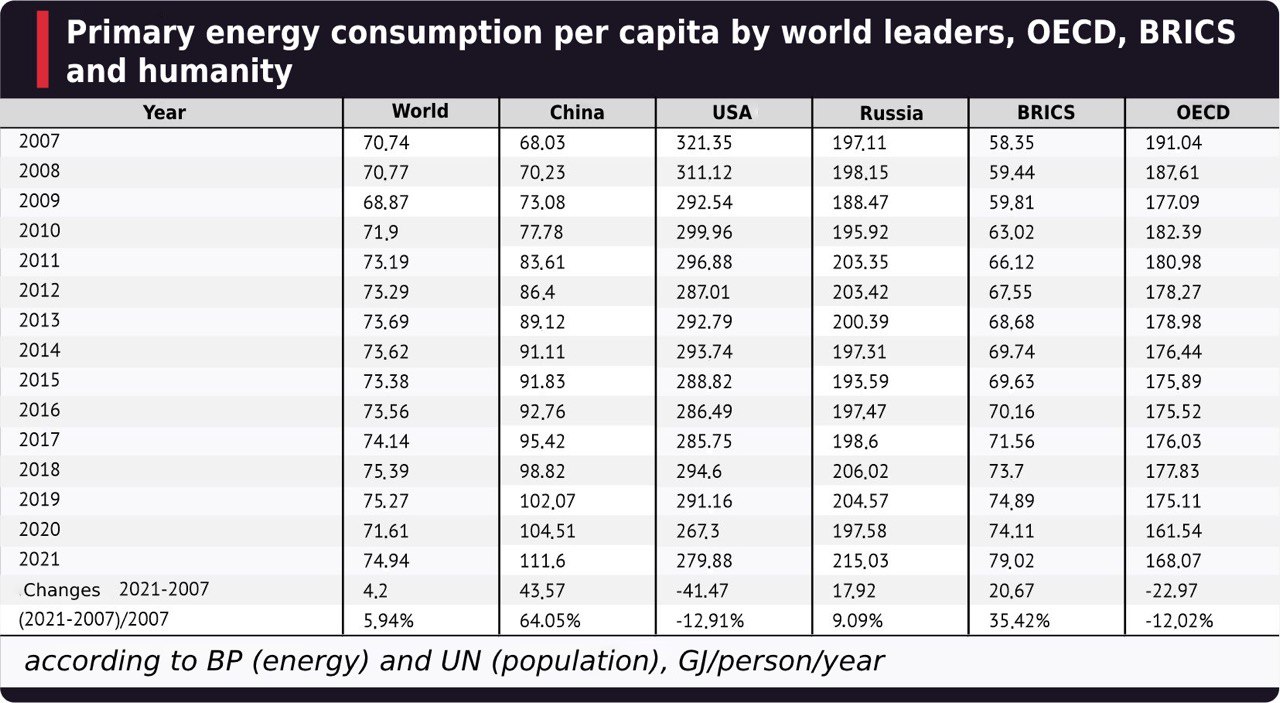
Table 1 demonstrates the energy consumption of mankind and world leaders in more detail. It shows that over 15 years, energy consumption in the world has grown by 24.3%, with China providing most of the increase, which accounted for 58.24% of the total increase in world energy consumption. Thanks to China and Russia, the share of the world leaders in energy consumption is growing and will soon reach 50%.
There are three groups of countries that can be distinguished in the global energy market: the Organisation for Economic Cooperation and Development (OECD), OPEC+ (oil exporting countries that have signed the OPEC+ agreement) and countries outside these blocs. The OECD and OPEC+ blocs traditionally hold opposing positions in the world energy market with a focus on oil and oil products. Countries outside these blocs are also pursuing an active policy in the global energy market, but their association is not institutionalised.
In the world energy market, the OECD represents the interests of net energy importers. Led by the United States, the bloc includes 37 countries, with 22 of them from the European Union.
The OPEC+ agreement represents the interests of net energy exporters. The block leaders are Russia and Saudi Arabia. In total, the OPEC+ agreement includes 23 countries, of which 13 are members of OPEC.
The leader of the countries outside the bloc is China, which dominates the countries of Asia and, in part, Africa. This block can be characterised by a high, unrealised potential for growth in energy demand.
TABLE.1
1.2. Factors affecting primary energy consumption
Three main factors account for the growth of energy consumption by the humanity:
1. Population growth.
2. Growth in energy consumption per capita due to the development of production and consumption technologies in developing countries.
3. Growth of energy consumption per capita due to the development of underdeveloped countries.
The factors are listed in descending order of their influence on energy consumption. The main driver of energy consumption growth is population growth. Changes in energy consumption in countries belonging to different groups are different. Traditionally, three groups of countries are distinguished:
• economically developed countries, which include 37 countries that are members of the Organisation for Economic Cooperation and Development (OECD)
• developing countries, which include Brazil, Russia, India, China and South Africa (BRICS association), and some other countries
• underdeveloped countries, of which there are more than 150.
During the 20th century, OECD countries went through an extensive stage of technological development, which boosted energy consumption in these countries. In the 21st century, the situation has changed, and the OECD countries, in general, have moved to an intensive stage of development. At this stage, the improvement of technologies prevails, which explains a decrease in the energy-output ratio of production and a decrease in energy consumption per capita. This is clearly seen in Fig. 3 and 4, as well as in Table 2.
FIG.3
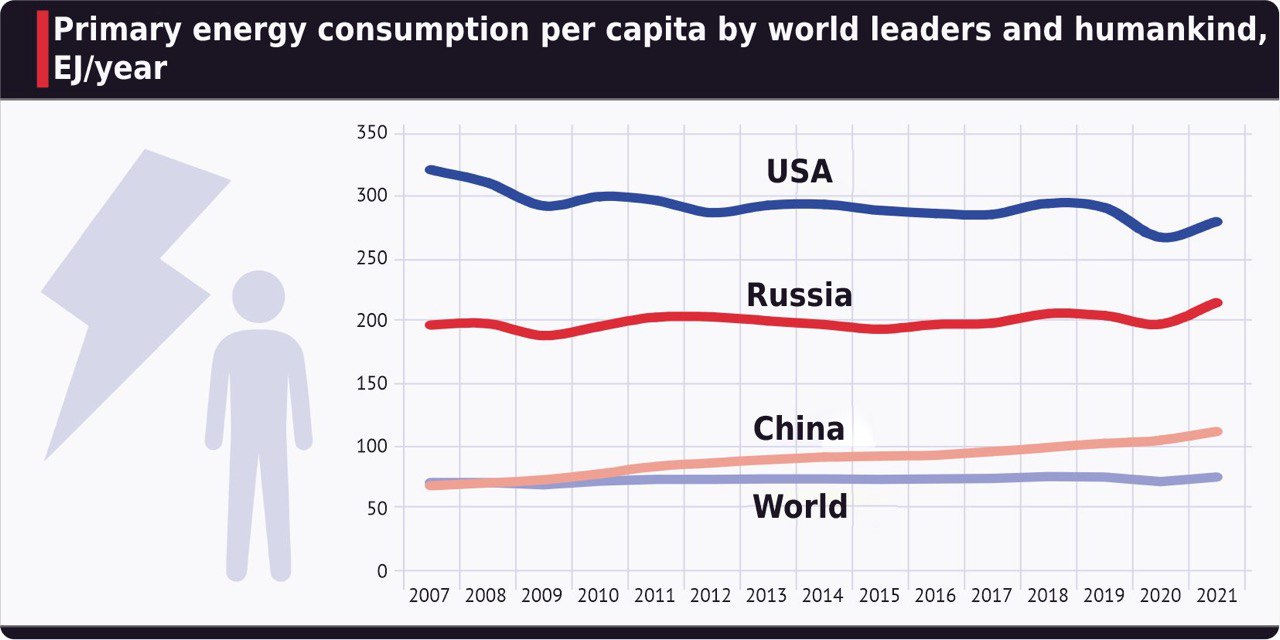
Emerging countries, which include world leaders China and Russia, are still moving through an extensive stage of technological development. They see their per capita energy consumption grow, which is set to reach a plateau and then begin to decline. Depending on climate conditions and the economic development trends, energy consumption in these countries will plateau at a specific level of 150-200 GJ/person/year, which means that Russia is close to reaching the plateau.
FIG.4
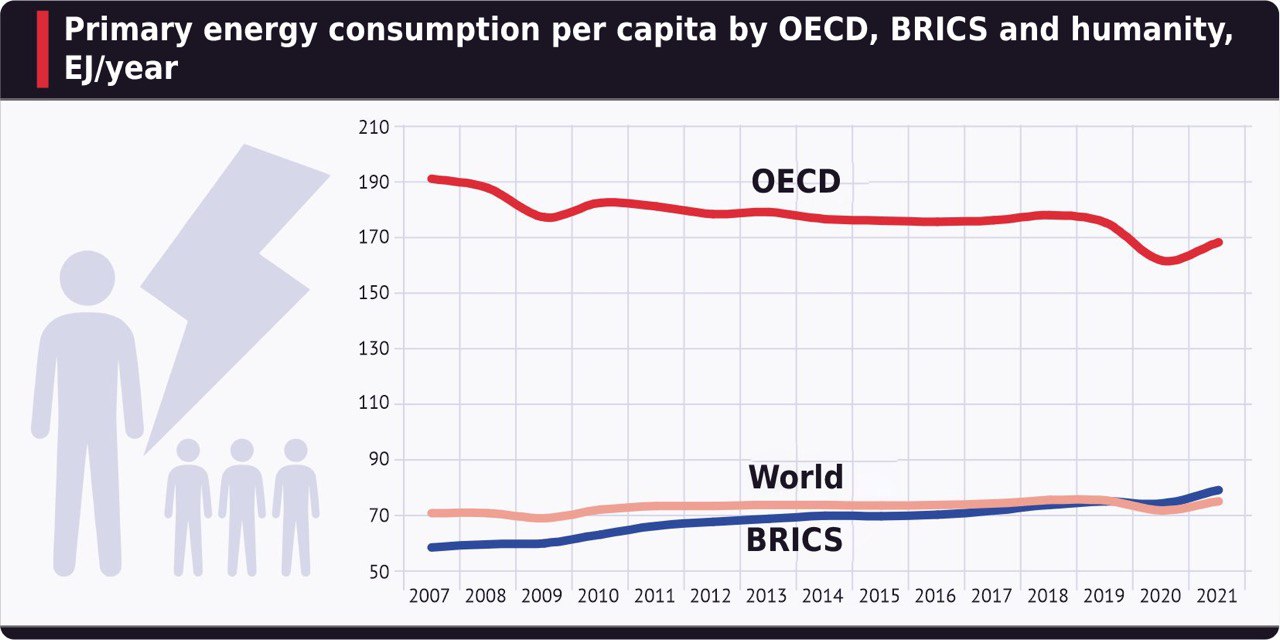
TABLE 2
At present, developed and developing countries compensate for changes in each other's energy consumption, and the growth of specific energy consumption in underdeveloped countries has been stopped. Therefore, the growth of energy consumption in the world is now controlled by the growth of the human population, as can be seen in Fig. 5. The dependence of energy consumption on the size of mankind in the last fifteen years is linear with a correlation coefficient of 0.947.
FIG.5
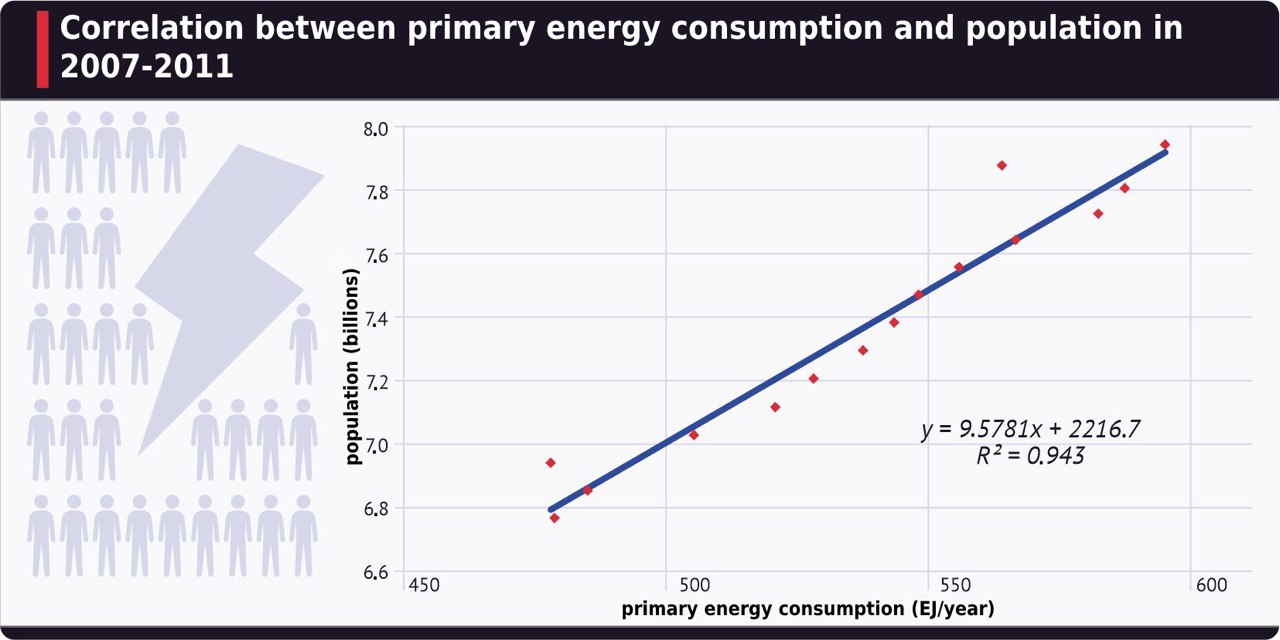
If not for the global economic crises of 2007-2009 and 2020, and the current global energy crisis, the correlation coefficient would be almost equal to one. This makes it possible to predict with high accuracy the change in energy consumption in the world if the conditions for the development of international relations do not change. They are now in a high degree of uncertainty due to the worsening economic crisis resulting from the COVID-19 pandemic and the international energy crisis.
The uncertainty of international relations makes long-term forecasting unrealistic. Several scenarios are possible, but they are all variations of two scenarios: a scenario of medium-term reduction in demand for energy resources ("war scenario") and a scenario of continuous growth ("peace scenario").
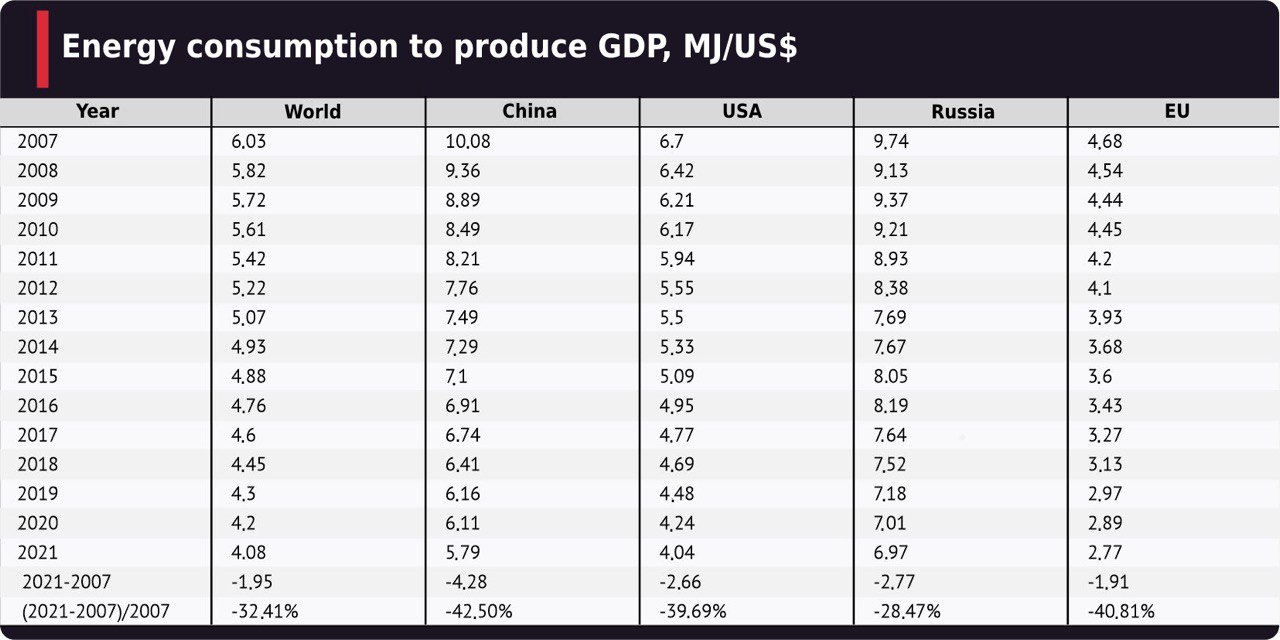
Fig. 6 and Table 3 show the change in energy costs for the production of USD 1 GDP (PPP). For brevity, this indicator is hereinafter referred to as "GDP energy efficiency". Analytical agencies of the OECD countries tried to introduce similar indicators, but all known attempts were unsuccessful.
Graphs in Fig. 6 show that the most energy efficient economy in the world is the EU economy. The energy efficiency of China's economy is growing at the fastest pace in the world, while the energy efficiency of Russia's economy fluctuates. A more detailed comparison of the energy efficiency of the leading countries and the world as a whole is shown in Table. 3.
FIG. 6
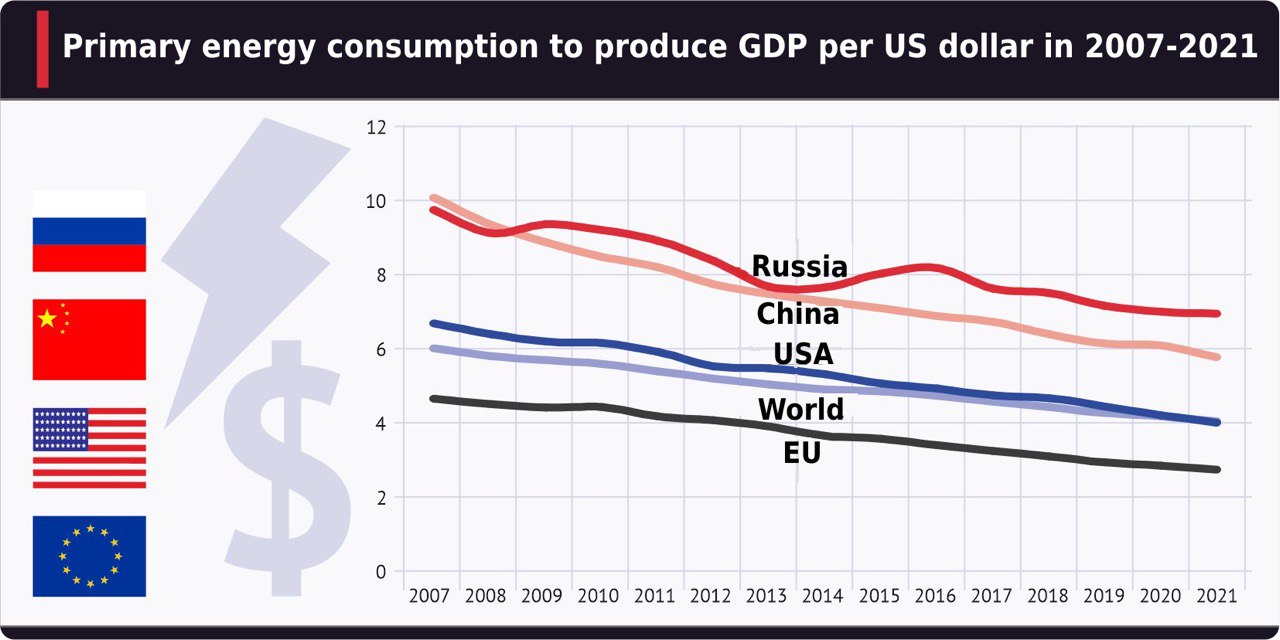
TABLE 3
1.3 Primary energy consumption by fuel type for 2019, 2020 and 2021
The distribution of primary energy consumption by fuel type strongly affects the global climate change of the Earth and the local state of the environment in individual countries. There is a need to work out agreements on maintaining the ecological balance, both bilateral and collective. The monitoring of the energy balance of countries is therefore in demand by the global community.
There are several sources of primary energy: oil, gas, coal, nuclear sources (abbreviated as atom), hydroelectric power (hydro), and renewable energy sources (RES).
Since the late 2000s, the development of renewable energy, primarily solar and wind power plants, has accelerated. This led to an intensification of competition between primary energy sources, aimed to redistribute financial flows.
During the 2010s, the division of energy sources into carbon and non-carbon came into use. These terms have come to be used interchangeably with, and often instead of, "environmentally harmful" and "environmentally friendly" ("clean"). For a long time, the division had a seemingly paradoxical character. Depending on the current need, nuclear energy was either included or not included in the list of carbon-free sources, although from a physical point of view, carbon dioxide is not emitted during the production of electricity at nuclear power plants.
Carbon-free energy sources were most actively developed in China and the European Union. However, the two have taken fundamentally different approaches. The EU relies on the unilateral development of renewable energy due to the reliability and volume of other energy sources. China strives to harmoniously develop all energy sources, without giving a clear preference to any of them. A striking example of the difference in the approaches concerned coal generation: the European Union is closing coal-fired power plants, having made a short pause during the energy crisis of 2022, while China is modernising them, increasing efficiency and reducing emissions.
Pressure on "carbon" energy sources in the European Union is increasing with the adoption of carbon taxes. At the same time, peculiarity of the local approach to the development of carbon-free generation came into conflict with the need to ensure the stability of energy supplies. With the abandonment of coal generation, the attractiveness of investments in gas-fired power plants has decreased, and the profitability of existing ones has noticeably suffered due to an increase in the share of wind and solar power plants. In addition, it jeopardised the French economy, where about 70% of electricity is generated by nuclear power plants.
As a response to the arising contradictions, nuclear and gas power plants were included in early February 2022 in the EU Green Taxonomy. Thus, the atom and gas were recognised as environmentally sustainable activities for investors in the context of the "Green Deal" as transitional technologies, but with a number of conditions. Gas-fired power plants must be built by December 31, 2030, and by December 31, 2035, they must be using 100% renewable or low-carbon fuels. The "green" status of nuclear power plants will be received if a construction permit is obtained before 2045, and if by 2050 a detailed plan is provided for the creation of a facility for the disposal of radioactive waste. The corresponding changes in European legislation will come into force on January 1, 2023.
The "Green Taxonomy" is non-binding and serves only to justify and attract private investment. But for the first time, it has provided legally sound and consistent guidance to both EU member states and outside players on which energy sources can be considered carbon-free or "clean".
Based on the parameters set by the European Union, the share of "clean" electric power industry in Russia stands at 33.86%, excluding gas-fired power plants; and about 81% including gas generation.
If we transfer this approach to the total consumption of energy, then Russia seems to be leading by the share of "clean" energy among industrialised countries. In the energy balance of the Russian Federation, carbon-free energy sources account for 13.07%, and 67.67% taking into account natural gas. In the USA, the share of carbon-free energy sources is 50.63%, in China − 25.93%, and in the European Union − 53.1%.
Russia's leading position in clean energy is explained by the fact that Russia, as a global energy superpower, has equal access to all sources of primary energy. And the development of the Russian energy industry is following the "Chinese" (harmonious) scenario.
However, it is worth noting that the transfer of the principles of the electric power industry to the general energy balance is partly conditional, since the consumption of primary energy sources also depends on the ratio of vehicles to population, the development of processing industries, the organisation of space heating, etc. In other words, primary energy consumption depends on the structure of the industrial sector of the economy, the well-being of citizens and the climate.
FIG. 7
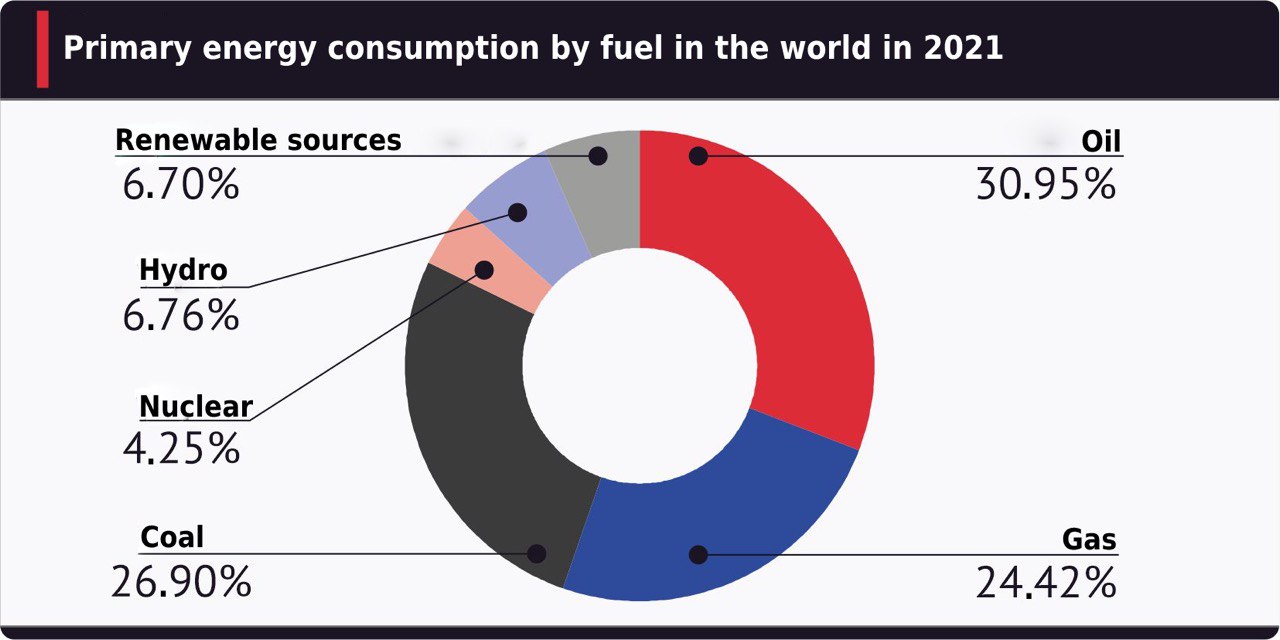
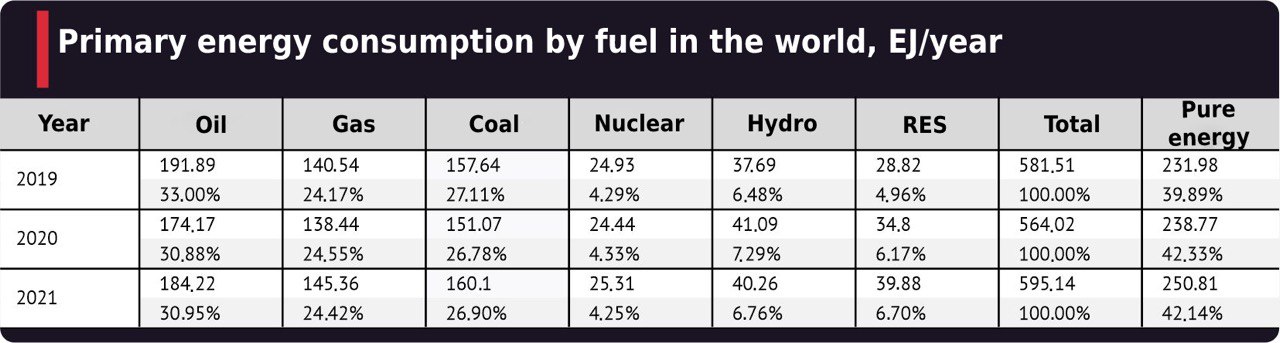
Let us look at the energy balances of the world as a whole, world leaders and some political unions. Fig 7 shows the world energy balance for 2021, and Table 4 shows the world balance of primary energy consumption by type of fuel for 2019, 2020 and 2021.
TABLE 4
The evidence helps dispel a few populist myths. The oil era has not passed, and the peak of oil has not been reached. "Black gold" was and remains the leading energy carrier in the world. Of course, the share of oil in world primary energy consumption is declining, but this reduction is insignificant and is partly due to the outpacing growth in primary energy consumption. There is no talk of any refusal from oil in the foreseeable future. The same goes for coal, which ranks second in the world's primary energy consumption.
The shares of combustible gases, nuclear energy and hydropower in the global energy balance remain virtually unchanged. The segment of renewable energy is growing intensively.
China is the world's largest energy consumer, and it is only growing its consumption rates. The country's energy sector is predominantly coal-based.
Table 5 shows the distribution of primary energy consumption in China by source for 2019-2021, and the diagram in Fig. 8 demonstrates this distribution for 2021.
TABLE 5
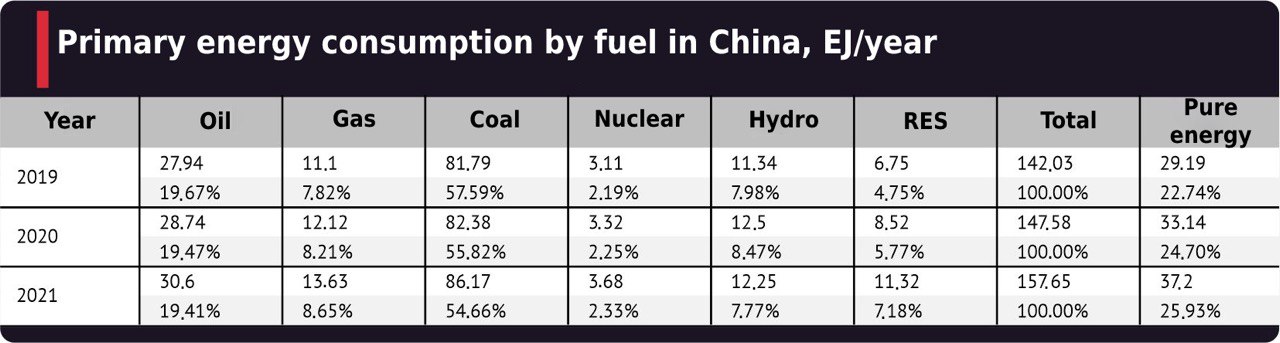
China is reducing its share of coal in the energy mix. This is happening against the backdrop of growing demand for energy carriers, a decrease in the specific consumption of coal for electricity generation and an increase in the installed capacity of "clean" power plants.
The change in the share of carbon-free sources and natural gas depends not only on the increase in the amount of "net" electricity generation capacity but also on several indirect factors, such as the state of the car market in China. Over the past three years, the Chinese car market has been declining sales (relative to peak values) and increasing sales of electric vehicles. Periodically renewed anti-COVID restrictions also have a noticeable impact.
FIG. 8
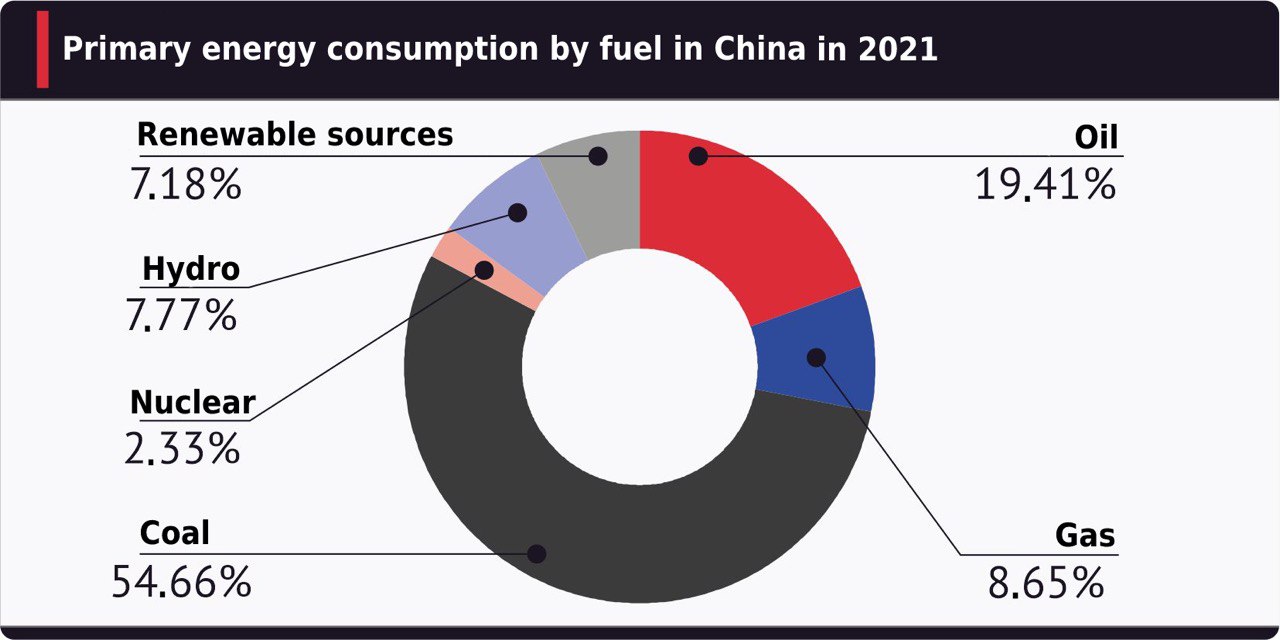
A key element in improving China's energy mix is the growing consumption of combustible gases. In 2001, the share of natural gas in China's power balance was 2.73%. In 2022, this share exceeded 9% and continues to grow.
The pipeline part of China's gas programme relies mainly on Central Asia and Russia, and in the longer view, also Iran. These countries own 98.7 trillion cubic metres of remaining recoverable reserves (RRR) of gas, which is 47.3% of proven gas reserves worldwide. In addition, about 3 trillion cubic metres RRR of combustible gases are concentrated in China, so China's gas programme has a solid foundation.
The use of renewable energy sources is growing at a faster pace. China has a complete production chain from raw materials to power generating equipment, which ensures high growth rates. RES equipment is also an export commodity.
The share of "clean" energy in China's energy mix is set to increase. But the growth rate is difficult to predict due to the current uncertainty in the global economy. The simmering crisis in the European Union, China's major trading partner, may have a negative impact on China's economic growth and, accordingly, reduce the dynamics of energy demand growth.
TABLE 6
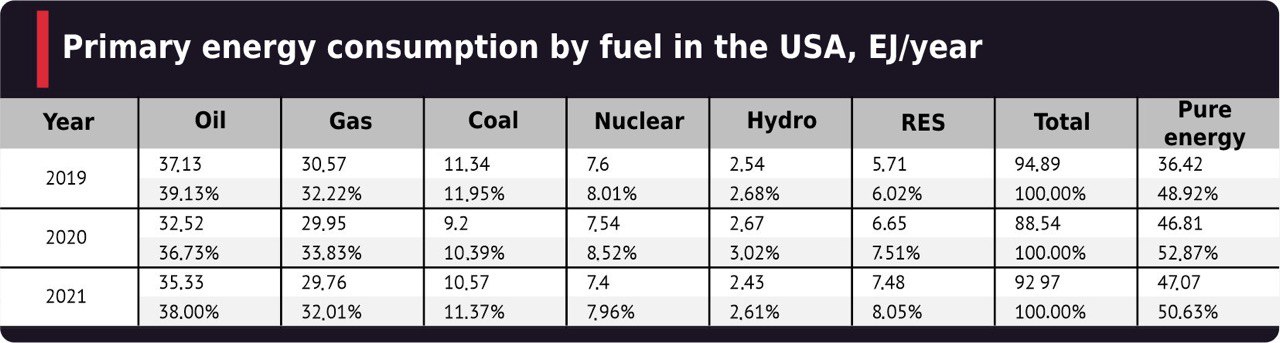
The USA takes the second place in the world in terms of gross energy consumption, far behind China. As can be seen from Table 6 and diagrams in Fig. 9, the US energy mix appears to be more balanced than China's, with no obvious bias towards one energy source or another.
Table 6 shows that, in general, the US energy balance is stable, with only the share of renewable energy growing. Unfortunately, this has had little effect on the overall share of "clean" energy sources so far, and oil remains the main source of primary energy in the United States.
If we look at the changes in the energy balance of the United States since the late 2000s, we find a noticeable decrease in the share of coal, which accounted for 22.82% in the energy mix in 2009, and 11.37% in 2021. On the contrary, the share of natural gas increased to 32.01% from 26.98%.
This was the result of a surge in natural gas production in the country, from 541.8 billion cubic metres in 2009 to 934.2 billion cubic metres in 2021. The increase in production led to a fall in prices, which in turn made gas-fired power generation more attractive than coal or nuclear. This drove the American coal industry into a protracted crisis and led to an almost two-fold drop in production over the course of ten years.
The strategy of the current American leadership tends to the European scenario of energy development – a sharp rejection of traditional energy in favour of renewables. But the large volume of produced gas partly hinders the implementation of the most radical "green" plans. At the same time, we can expect further degradation of the coal segment of electricity generation and a reduction in the share of nuclear power plants as existing capacities get closed.
Nevertheless, the American energy sector has found itself in a difficult predicament. As exports of liquefied natural gas grew, foreign markets began to have an increasing impact on the US domestic market. To date, this has translated into a spike in prices − to levels 2-3 times higher than the average for the same period over the past ten years. Of course, the cost of gas in the United States (about USD 300) is still significantly lower than that in the European Union. However, it still affects the price of electricity and reduces the attractiveness of gas generation.
On top of that, the challenging scenario of the "green" energy transition promoted by the country's political leadership is still possible, even though it has been virtually suspended over the global energy crisis.
FIG. 9
The third world leader is currently Russia. Russia controls 25% of international energy trade and is the world's top energy exporter and one of the world's top electricity exporters. This is not about global energy production but about interstate trade. Let us have a look at the gas market, for example.
In 2021, 4 trillion cubic metres of combustible gases were produced worldwide, of which 1.22 trillion cubic metres was exported to other countries. Russia's share in interstate gas trade was 19.78%, with 241.3 billion cubic metres.
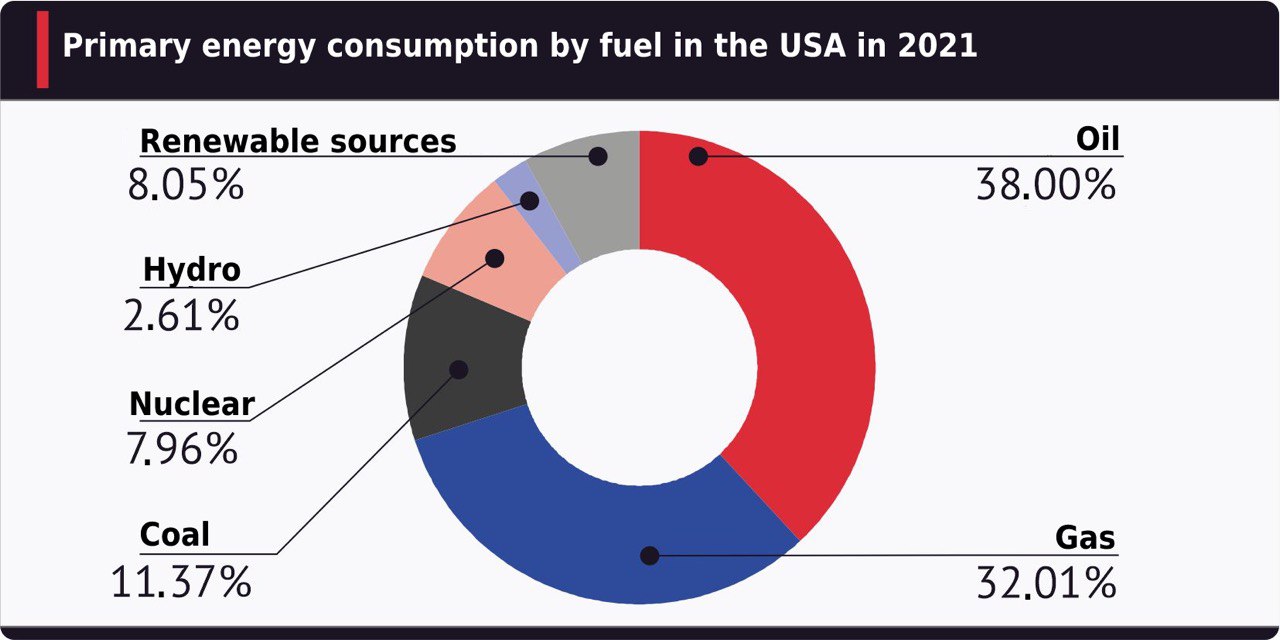
Diagram on Fig. 10 shows the distribution of domestic primary energy consumption in Russia by fuel type in 2021. But this is not the production of energy in the country. In Russia, domestic energy consumption is much lower than its production. Thus, Russia exports up to 75% of the extracted "black gold" in the form of oil and oil products.
FIG.10
TABLE 7
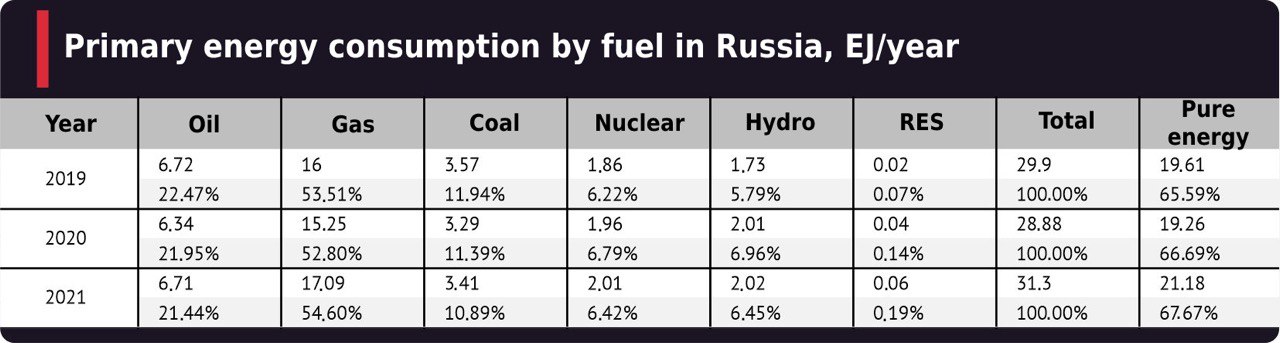
Table 7 shows that the energy mix of Russia is very different from that of other countries and the world as a whole. The main fuel type in Russia is gas, so the energy sector in Russia is the most environmentally friendly among all major industrialised countries. Renewable energy sources, except for hydropower, are not very well developed in Russia. They are only beginning to grow. The share of wind and solar power plants in the installed capacity of Russian generation reached 1.62% by the beginning of 2022.
Russia seems interested in the OECD's energy sector since it is Russia's main competitor on the world stage. Among the members of the OECD, it is the EU has recently experienced a severe energy crisis. Therefore, to conclude this section, let us compare the energy mixes of the OECD and the EU.
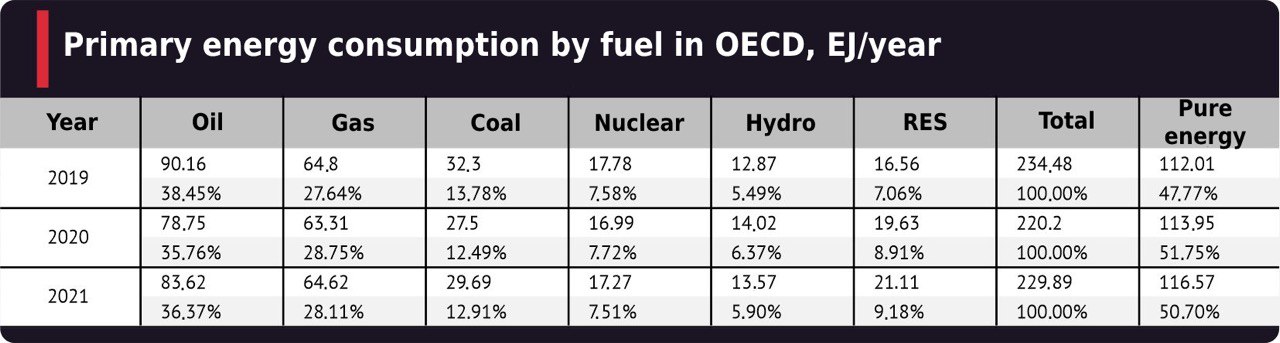
Fig. 11 and Table 8 show the energy balance of the OECD. The share of the OECD in world energy consumption is about 40%. The diagram on Figure 11 shows that fossil fuels (oil, gas and coal) account for 70% of energy consumption, and it is impossible to replace them with other fuels in the foreseeable future. At least 25% of this fuel comes from Russia. But plagued by the economic crisis since the second half of 2021, the EU may have a sharp reduction in energy demand.
FIG. 11
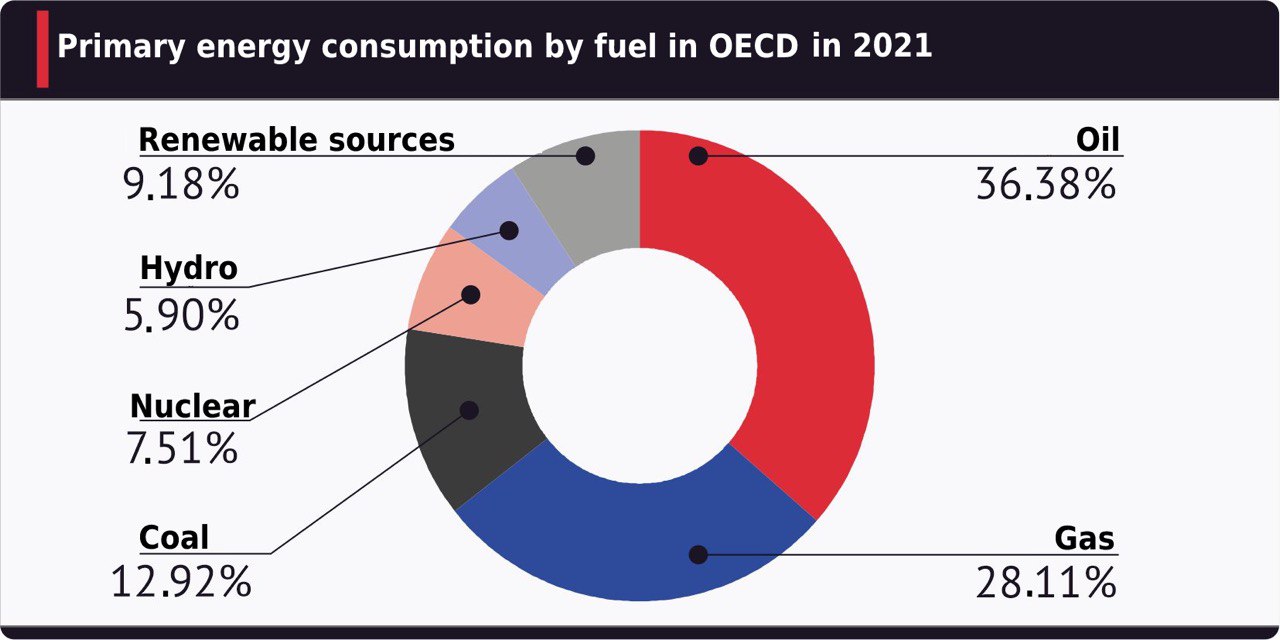
TABLE 8
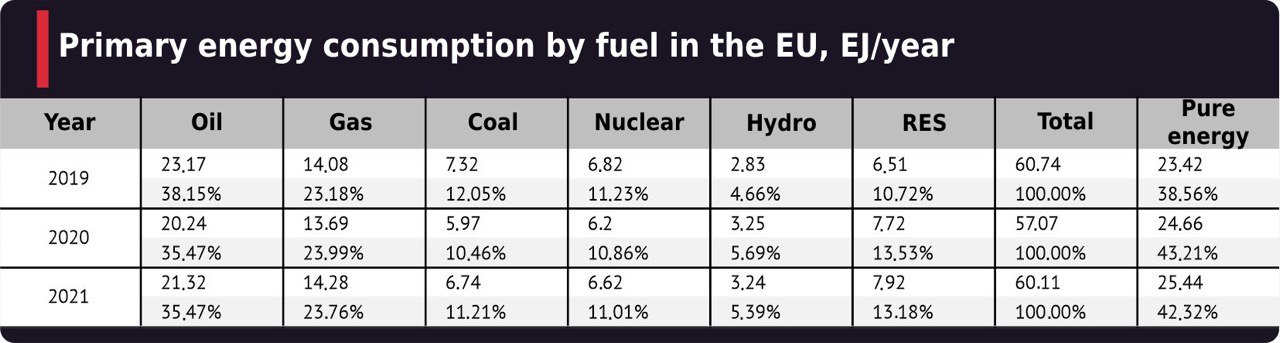
The diagram in Fig. 12 shows the distribution of primary energy consumption in the EU by type of fuel for 2021. As we can see, the share of "green" or renewable energy in the EU's energy mix is the highest globally, reaching 13.17% last year.
Wind energy and solar energy are responsible for a relatively significant share of the EU balance. But the last two years have demonstrated that these energy sources are unreliable because humanity cannot control the climate. At the most unfortunate moment, the wind may stop, and the clouds may scud across the sky and cover the sun for a long time. Hydropower also depends on the weather but to a much lesser extent.
FIG. 12
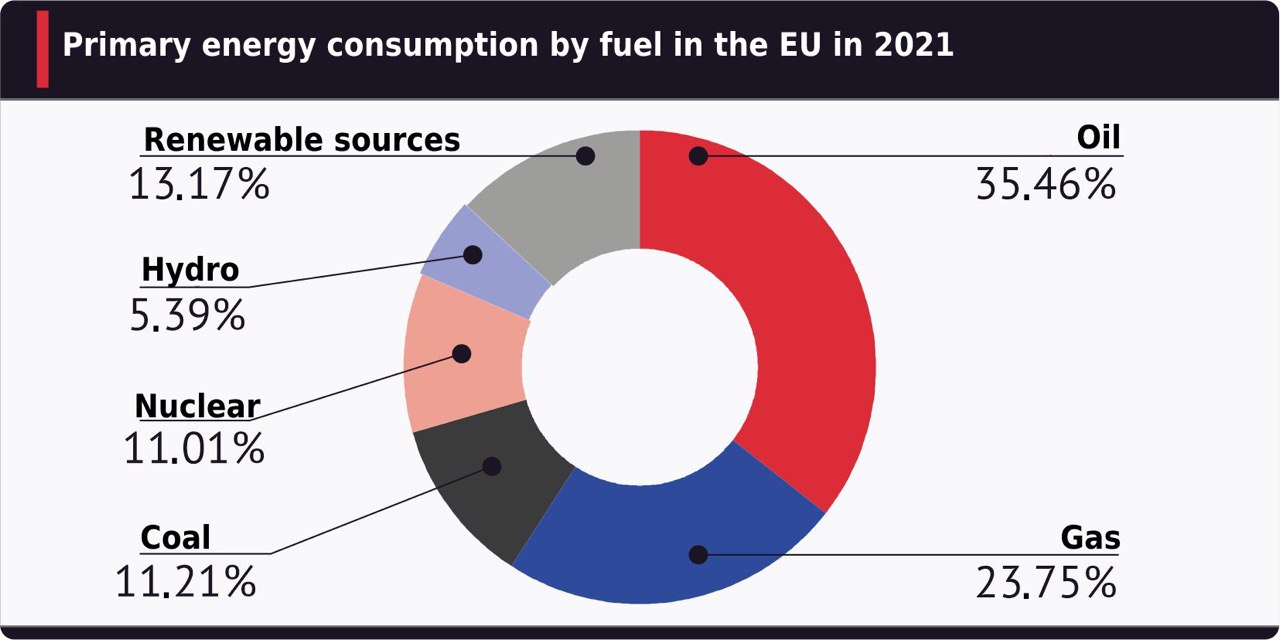
TABLE 9
The first nuclear power plant in the world was commissioned in Russia in 1954. Since then, for 68 years now, nuclear energy has been developed in many countries around the world. Significant experience has been accumulated.
The leadership of European countries, such as Germany, Belgium, and Spain, has decided to abandon nuclear power plants.
Consequently, fossil fuels – oil, gas and coal – continue forming the basis for the EU's energy. There are not enough deposits of these minerals on the territory of the European Union, but the local energy industry depends on them by 70.44%. This is clearly seen in Table 9. As a result, the EU is critically dependent on energy imports.
In the late 2000s, the EU tried to counter the risks associated with growing dependence on energy imports by liberalising the gas and electricity markets, as well as by accelerating the development of the renewable energy segment.
In countries and regions with a large share of renewable energy sources, the availability of their own energy resources needs to be understood as a broader notion. It should go beyond oil, gas, coal and hydro resources only and imply the presence of its own production of power equipment, including solar panels and wind turbines, own resources of lithium, nickel, rare earth metals, etc. The European Union most aptly illustrates this approach.
In a broad sense, the development of the RES segment does not reduce the EU's dependence on energy imports but strengthens it.
In the late 2000s, the European Union was the largest equipment manufacturer for solar and wind power plants. The development of the solar and wind power generation segment was supposed to reduce the EU's dependence on growing energy imports and give an additional impetus to the European industry, creating a growth point necessary to overcome the consequences of the 2007-2009 crisis quickly.
However, the European Union possessed only the final link in the production chain. It did not have the local extraction of the necessary metals and the production of the element base. Raw materials and components had to be purchased from other countries, mainly China.
During the 2010s, China expanded its own production of generating equipment for solar and wind generation, which began to provide both domestic and foreign markets. Unable to withstand the competition, European manufacturers of equipment for solar power plants started to go bankrupt.
At the moment, almost all wind turbines used in the domestic market are still produced in the EU. But all five local wind turbine manufacturers are operating at a loss. Industry association WindEurope names severe international competition as one of the reasons. First of all, with Chinese companies.
If the current trend continues, European wind equipment companies will be forced to stop operations or move production to China.
Thus, by reducing dependence on coal and gas imports, the segments most affected by the development of renewable energy sources, the European Union is increasing its reliance on imported equipment for solar and wind power plants. At the same time, the European leadership urges to expedite the commissioning of renewable energy generation, thus calling to increase dependence on external supplies.
1.4 Conclusions and forecasts
The forecast of changes in global energy consumption is main forecast necessary for planning the development of the world economy. When elaborating the forecast, two correlations were used, obtained by processing data for the period from 2007 to 2021. The first correlation is shown in Fig. 13. This is the dependence of the global population on time.
FIG.13
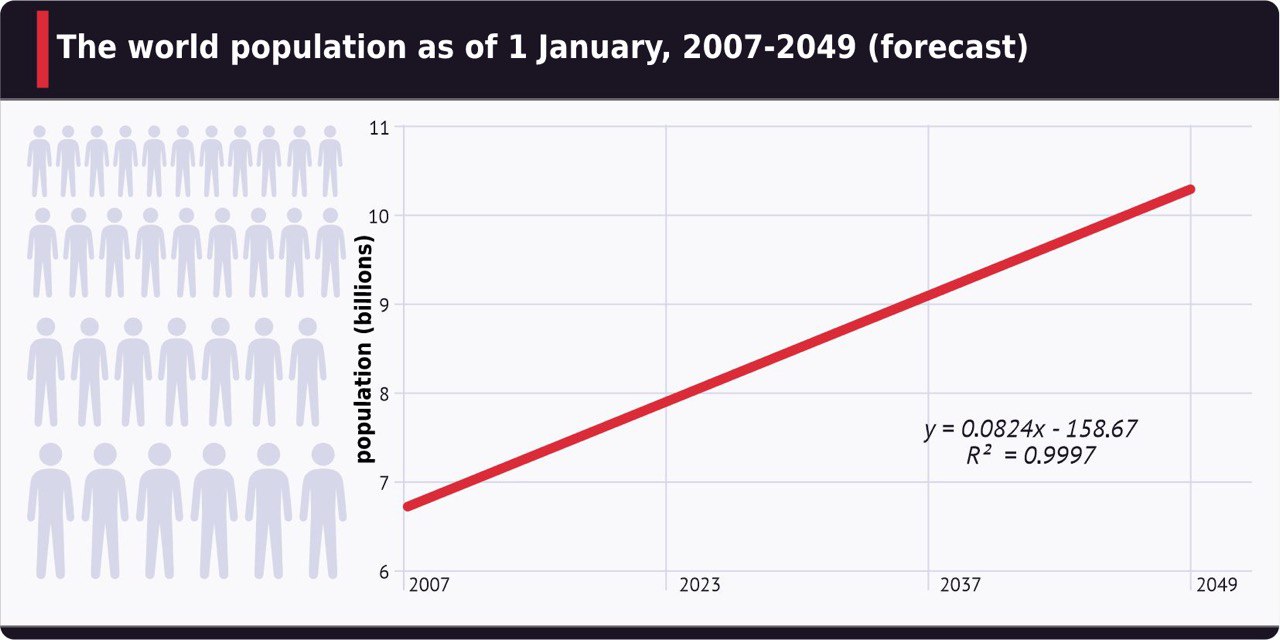
The formula for approximating the population size for the period from 1990 to 2021 and the value of the correlation coefficient, which shows that the approximation is quite reliable, are displayed on the plot area. The graph also shows the forecast for the growth of the human population until 2050.
The next step is to link the human population and energy consumption. To do this, we build a correlation dependence of primary energy consumption in the world on the population for 2007–2021. Data for the crisis years of 2009 and 2020 are excluded since crises are not indicators of a regular change in energy consumption. The result is shown in Fig. 14.
FIG.14
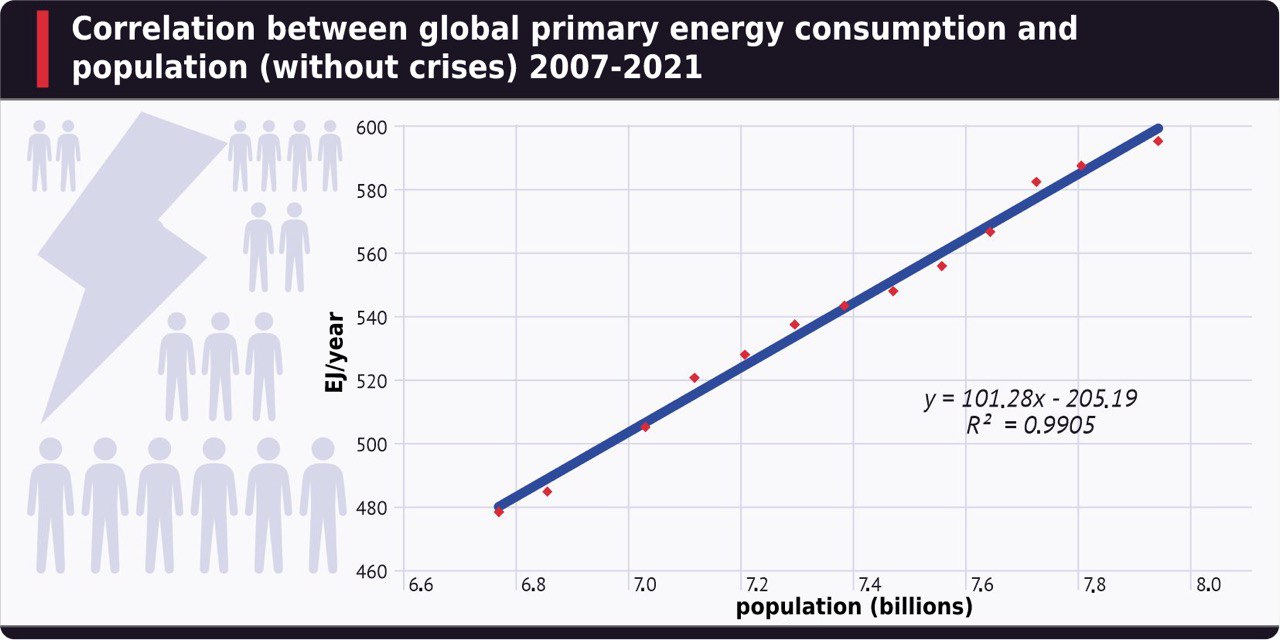
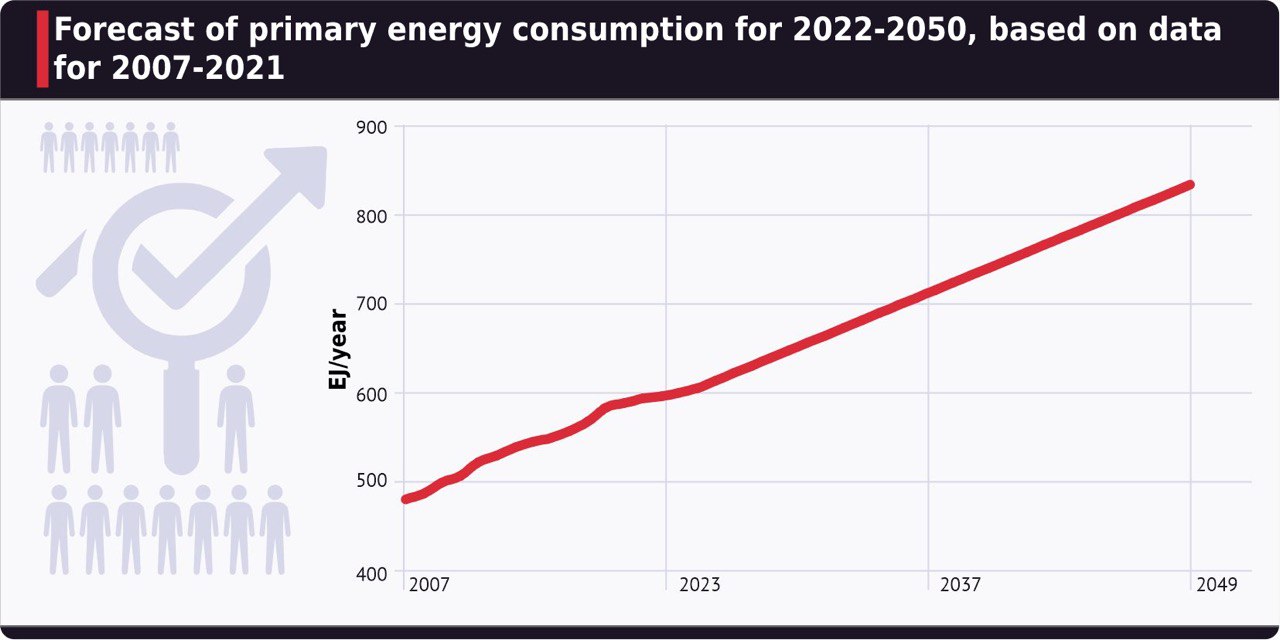
The formula for approximating data for the period from 2007 to 2021 and the value of the correlation coefficient, which shows that the approximation is quite reliable, are displayed on the plot area. Using the approximation formulas shown in Figs. 13 and 14, it is easy to make a forecast of energy consumption for the development scenario that corresponds to 2007-2021. The result of the forecast is shown in Fig. 15 and in Table 10.
TABLE 10
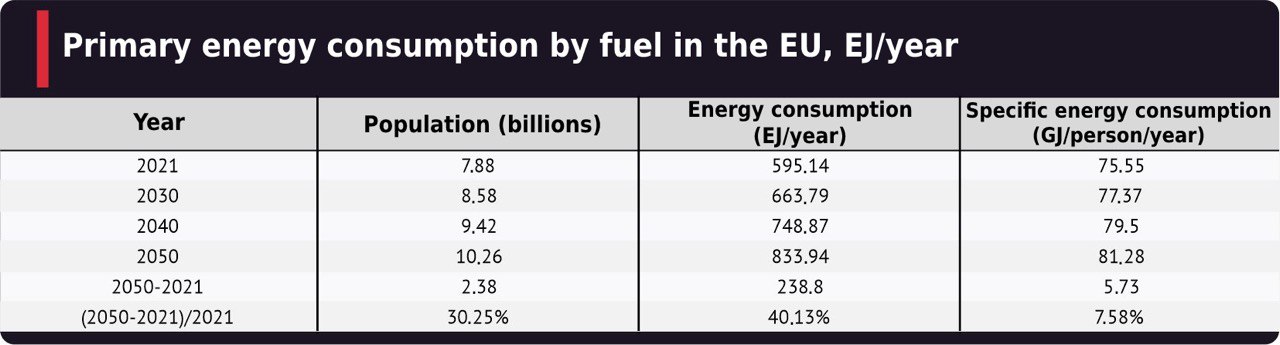
Table 10 shows that the overall annual primary energy consumption from 2021 to 2050 should increase by 40%. Given the depletion of oil, gas and coal reserves in most countries of the world, Russia's role in the global market will significantly increase due to unexplored and undeveloped territories, primarily in the Arctic and Eastern Siberia.
However, it is worth considering the trend observed today towards a decrease in the growth rate of the world's population. Also, the potential for growth in energy demand is not fully realised even with the current population. According to the UN, 733 million people have no access to electricity.
Africa remains the least electrified region − 568 million continent's inhabitants do not have electricity. The share of the such population south of the Sahara Desert is exceptionally high − 77%.
Harmonious economic development of the regions of the world will not only solve the growing social problems but also increase energy consumption in volumes that humanity while maintaining current levels of per capita demand, will reach only by 2030.
The reverse process is also possible − the growth of social and economic problems will lead to a reduction in energy consumption in the medium term and a slowdown in the growth of long-term global demand. As we noted at the beginning, the current situation in the world creates great uncertainty.
FIG. 15
From the presented analytical study of global primary energy consumption, the following conclusions can be drawn:
1. The shortage of primary energy in the world is growing and will continue to grow in the long term.
2. Russia's share in international energy trade is the largest and amounts to 25%, as the demand for energy carriers grows, the share of the Russian Federation will increase.
3. Over the past 20 years, China has created an international base for its energy industry, which has ensured its development for the next 30 years.
4. The US energy base does not provide opportunities for the country's development in the medium term.
5. The energy crisis in the European Union has led to an economic crisis.


Market Passions")